Demos
Demo run log: AWS DevOps Agent with Secronyx
The full record of the AWS DevOps Agent demo: three investigations in AWS, with timelines, every screenshot, what the agent got wrong, what we fixed and the caveats.
This is the full run log. For the short version, start with Demo: AWS DevOps Agent investigates with Secronyx.
Two agents, one incident. AWS DevOps Agent is Amazon's autonomous on-call investigator. It reasons about an incident from metrics, logs and deployments, but it cannot see inside the operating system. In this demo it asks Secronyx for that view: open files, services, scheduled jobs, network sockets, logs, start-up items and a comparison with a healthy peer. Every call is read-only, limited to the hosts the agent's grant allows, and recorded in the audit log of the host that answered it.
At the same moment, the Secronyx Grafana bridge runs its own fixed investigation, keeps signed evidence and annotates the Grafana panel. That evidence verifies offline afterwards.
In the screenshots, teal boxes mark where AWS DevOps Agent calls Secronyx or uses what Secronyx returned. Amber marks what policy blocked and a check that failed.
Everything on this page comes from three investigations on 11 November 2026 in AWS's London region (eu-west-2). All times are UTC.
Why these investigations
A CPU spike can nearly be explained from metrics alone. The two investigations that lead this page can't be: the metric says something is wrong and nothing about why.
| Investigation | What the metric shows | What only the host can show |
|---|---|---|
| The disk is full, but nothing on it is big | web-1's root filesystem drops from 80% free to 17% | A 4.9 GiB log that log rotation deleted while a service kept writing to it, the rotation rule that caused it, and a configuration change that exists only on web-1 |
| A quiet compromise on one of two twins | Unanswered outbound connection attempts on web-2 | A disguised service running a hidden script, a second, encoded restart mechanism in cron, and the process trying to reach an address that never answers; web-1 has none of it |
| High CPU on web-1 | One core busy | Which service, who started it, and that it is a legitimate workload, not a miner |
Both problems were set up on purpose, were harmless, and were removed afterwards. Each investigation was started by the Grafana alert alone.
How much steering: none in the first investigation. One follow-up message in the second, after it had finished. One in the third. Each is marked below.
What was running
- Three hosts on EC2: web-1 and web-2 (the web tier, labelled
role=web) and pci-db-1 (a database, labelledrole=dbanddata=pci). Each runs Secronyx, signs every result and dials out to the fleet proxy. None of them opens a listening port. - The Secronyx fleet proxy, behind an HTTPS load balancer that admits only AWS DevOps Agent's addresses for the region, the presenter and the proxy itself. It holds the label policy, the Grafana bridge and the evidence store.
- Grafana with Prometheus and the standard node exporter, with three alerts: root filesystem below 25% free, unanswered outbound connection attempts (TCP SYN retransmits), and more than 0.5 CPU cores busy. Each alert goes to two places: AWS DevOps Agent and the Secronyx bridge.
- An AWS DevOps Agent space with two capabilities: Grafana as a telemetry source, and the Secronyx fleet proxy as an MCP server.
The fleet proxy matters here. An agent space allows 500 tools, and you cannot register thousands of hosts one by one. One fleet proxy exposes nine tools, and through them the agent can reach every Secronyx check on every host its grant allows.
Investigation 1: the disk is full, but nothing on it is big
What was set up. orders-api, a stand-in web service, runs on both web hosts and writes its log to /var/log/orders-api/. Its log rotation rule has a classic bug: it deletes the old file instead of keeping it, and it neither truncates the file in place nor tells the service to reopen it. So after rotation the service keeps writing to a file that no longer has a name. On web-1 only, a systemd drop-in turns on debug logging, which writes a 5 GB burst. Rotation runs in the middle of the burst. The disk fills, and every directory still looks small: /var/log is 9 MB.
The alert said only that web-1's root filesystem was below 25% free, and pointed the agent at Secronyx's disk-full playbook and a comparison across the web tier. It named no cause.
Steering: none. Every finding below is the agent's own.
| Time | What happened |
|---|---|
| 08:33:26 | orders-api starts on web-1 with the debug drop-in. Rotation runs eight seconds later, mid-burst. |
| 08:34:05 | The burst is done: web-1's root filesystem is 84% used, and /var/log holds 9 MB. |
| 08:34:45 | Grafana's DiskSpaceLow alert fires. The Secronyx bridge runs the disk-full-log-growth playbook on web-1 (13 checks, all signed by web-1), saves an evidence case and annotates the disk panel. AWS DevOps Agent opens an investigation in the same second. |
| 08:35:07 to 08:37:42 | The agent makes 41 calls to Secronyx on its own, including 8 comparisons of web-1 with web-2: open files, services and processes. |
| 08:38:54 | The agent reports its root cause. |
| 08:41:00 | It proposes a mitigation plan for a person to apply, and finishes. It applies nothing. |
| afterwards | The bridge's evidence case verifies offline: 28 findings verified, none failed. |
What it found. In its own words: "orders-api (pid 6187, /usr/local/bin/orders-api, unit orders-api.service, started 08:33:26Z) has fd 1 and 2 attached to /var/log/orders-api/orders-api.log.1 (deleted), size 5,242,882,376 bytes. … This file accounts for about 98% of web-1's extra usage over web-2."
- It ruled out the usual suspects: directory sizes, inodes, mounts, quotas, core dumps, containers and LVM.
- It read the rotation rule on both hosts and explained why it strands the file. web-2 has the same bug, but holds only 3,301 bytes.
- Comparing the two hosts, it found that the drop-in exists only on web-1 and was written about a second before the service started. It called this the very likely trigger, but unconfirmed, because Secronyx does not return file contents.
- Its plan for a person: save the evidence, free the space in place without a restart by truncating the open file, remove the drop-in, and fix the rotation rule on both hosts. It also wrote a change specification, including an alert for space held by deleted files.
What it got wrong, and what we fixed. It said the rotation rule has "no rotate count". The rule says rotate 0, which is exactly why the file was deleted, but Secronyx dropped the zero when it reported the rule. It also noticed that a filesystem health check called / read-only while the mount list said read-write, and rightly treated it as a quirk. Both were bugs in Secronyx, and both are now fixed. So is the open-files check: it now reports the size of deleted files that are still open, which is what let the agent put a number on the missing space.
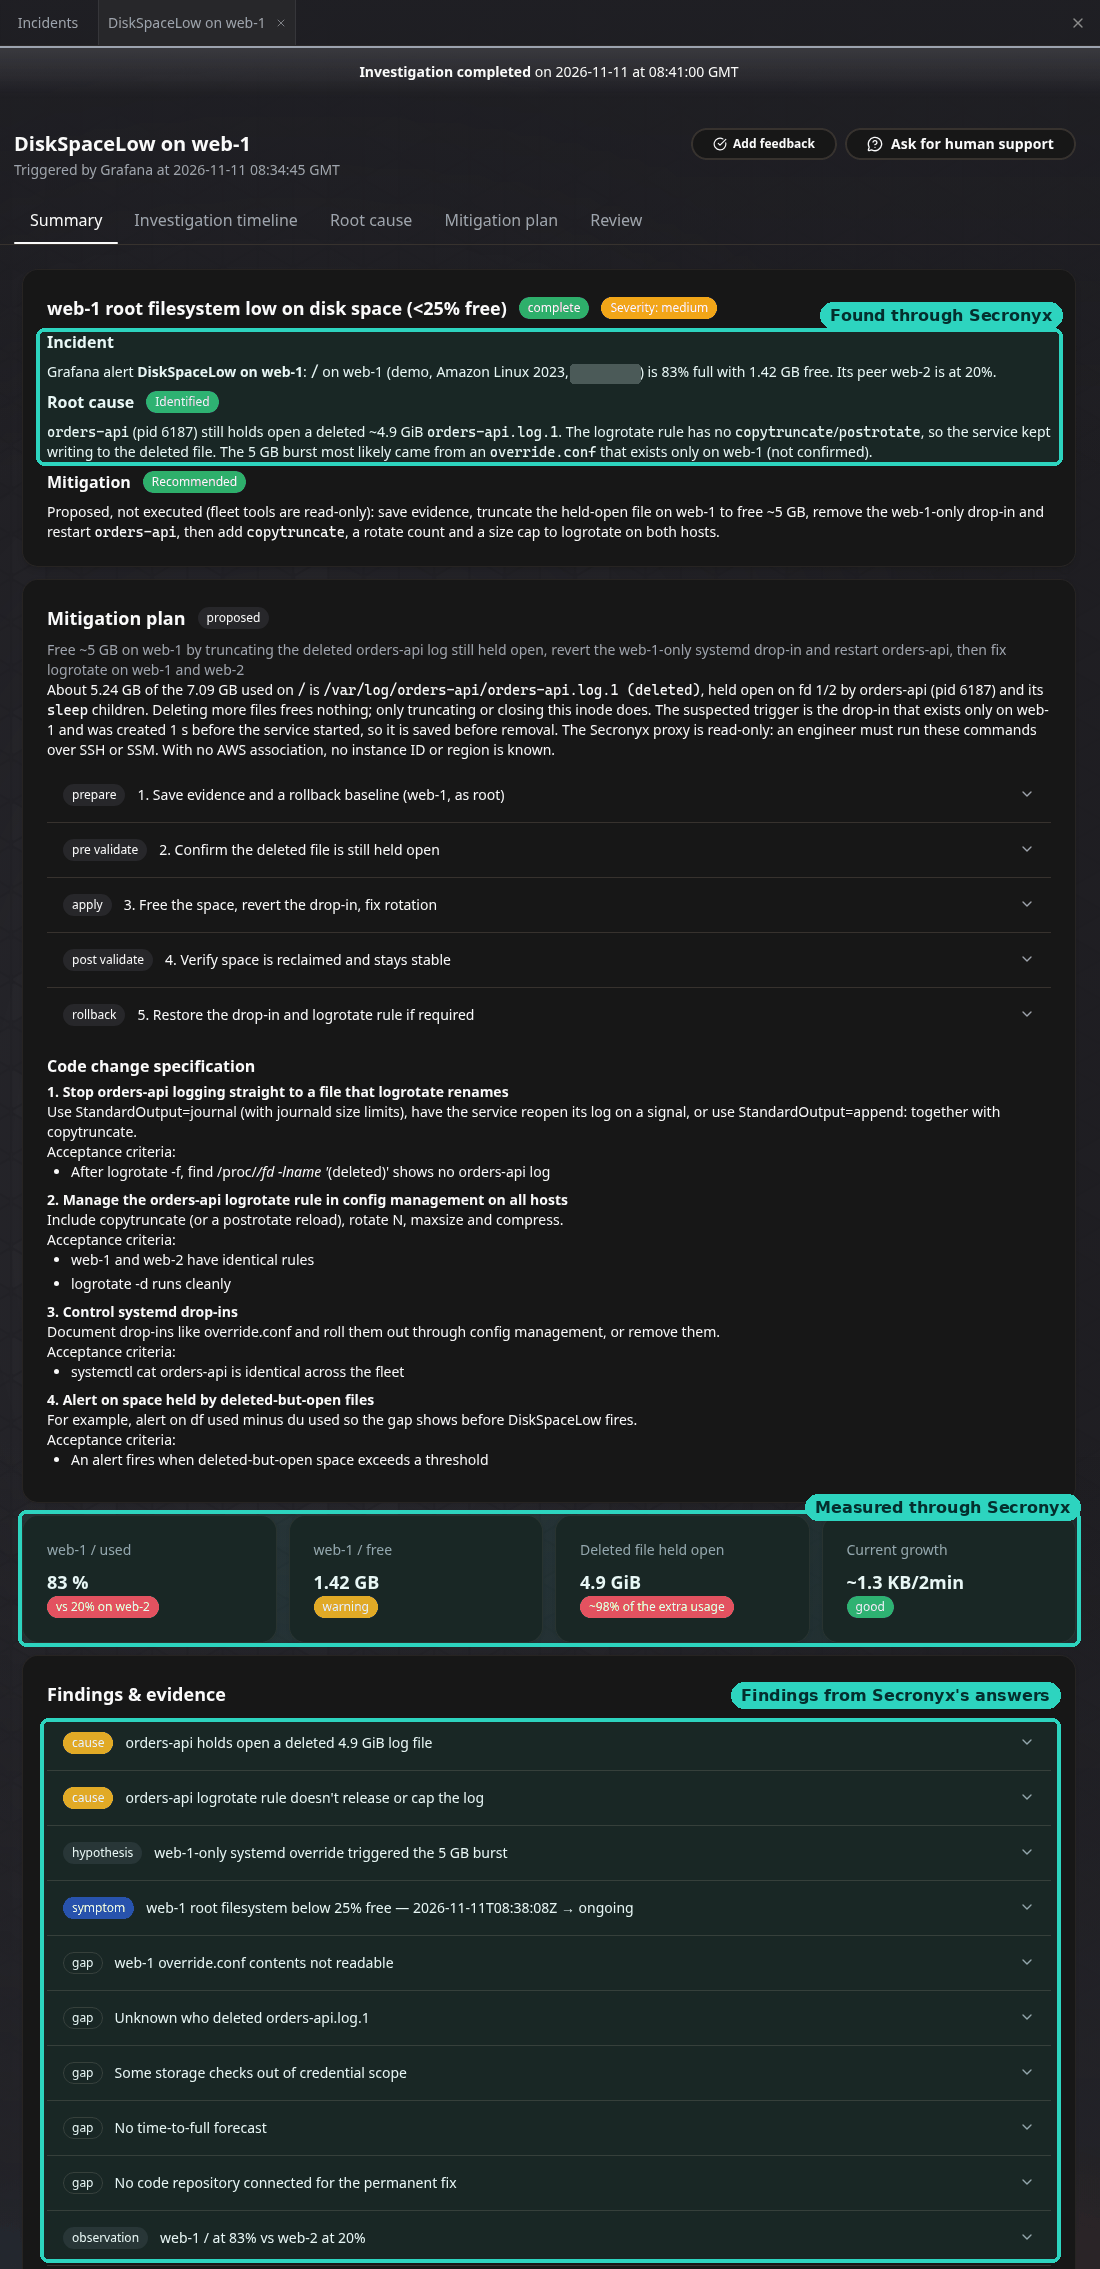
The investigation's summary. Teal boxes: what came from Secronyx. The root cause, the proposed mitigation, the numbers (83% used, 4.9 GiB held by a deleted file, about 98% of the difference with web-2) and the gaps the agent declared.
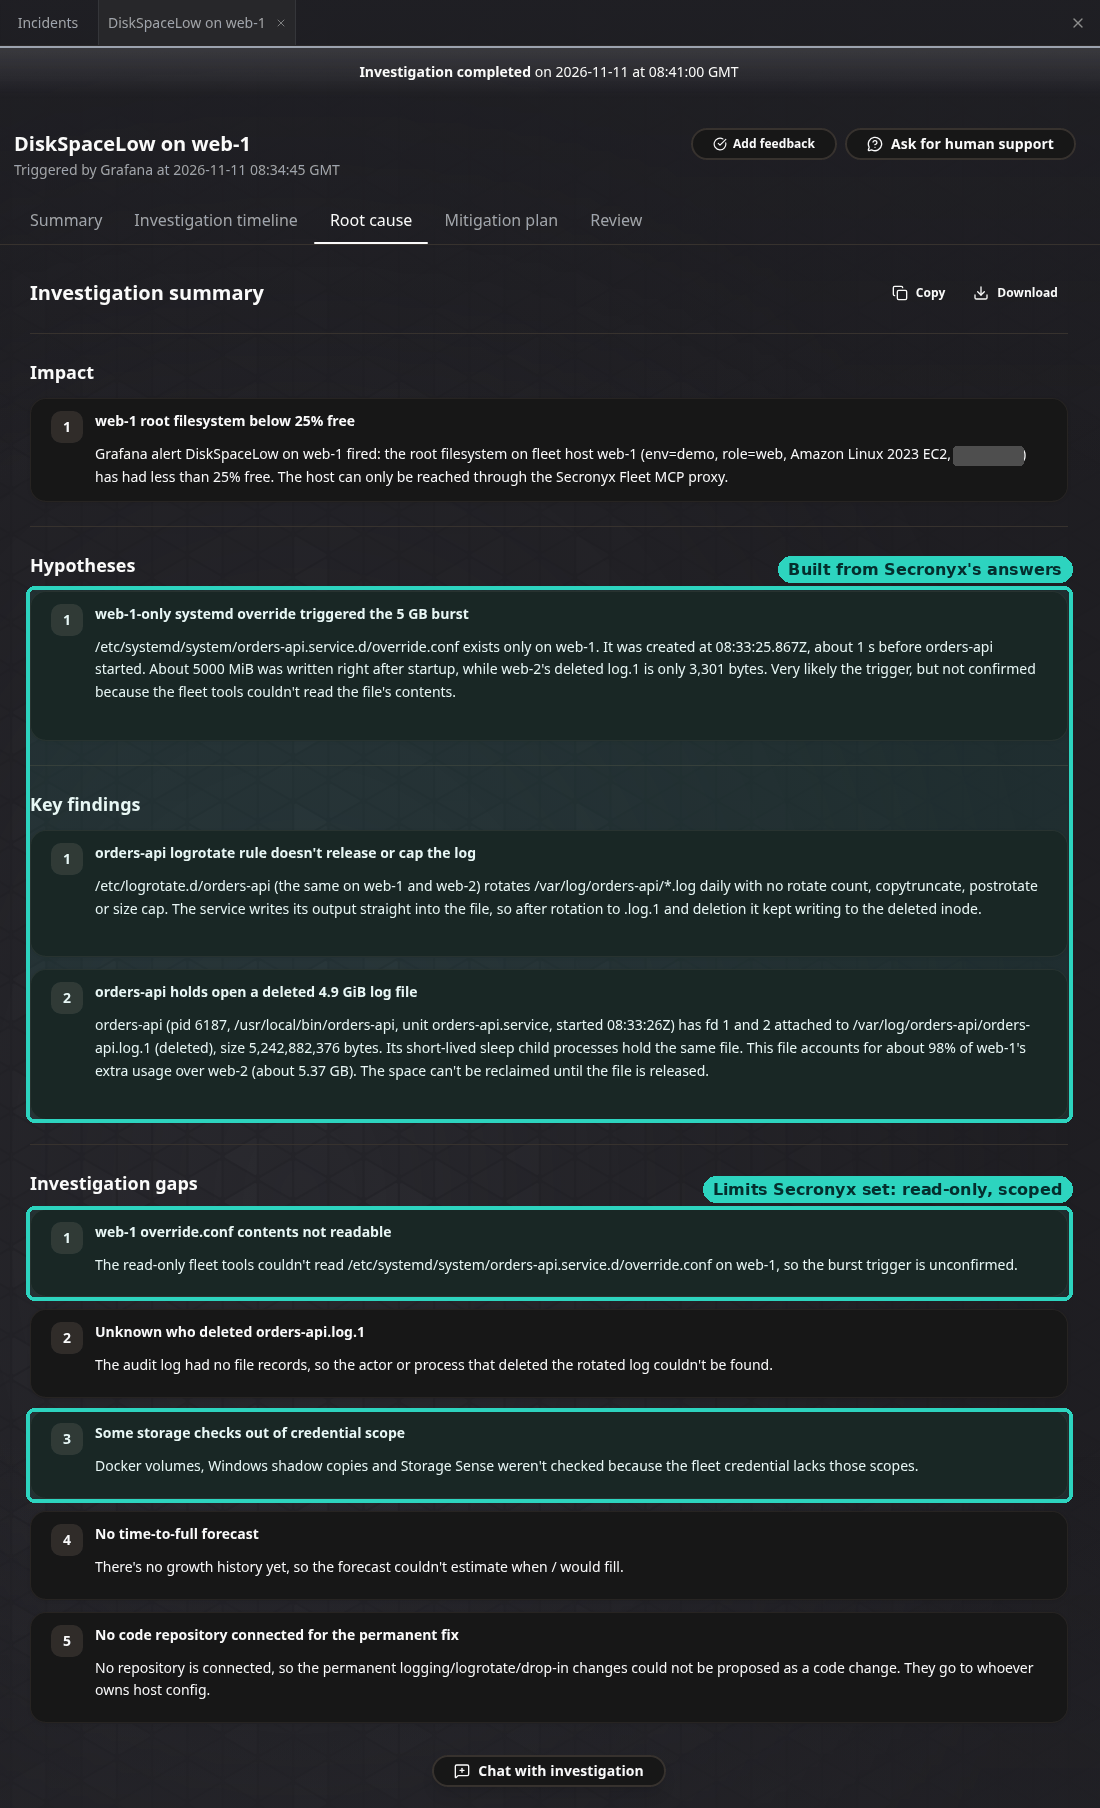
The root cause, with the hypothesis kept separate from what was confirmed, and five gaps it was honest about. Teal boxes: the findings built from Secronyx's answers, and two gaps that come from Secronyx's limits.
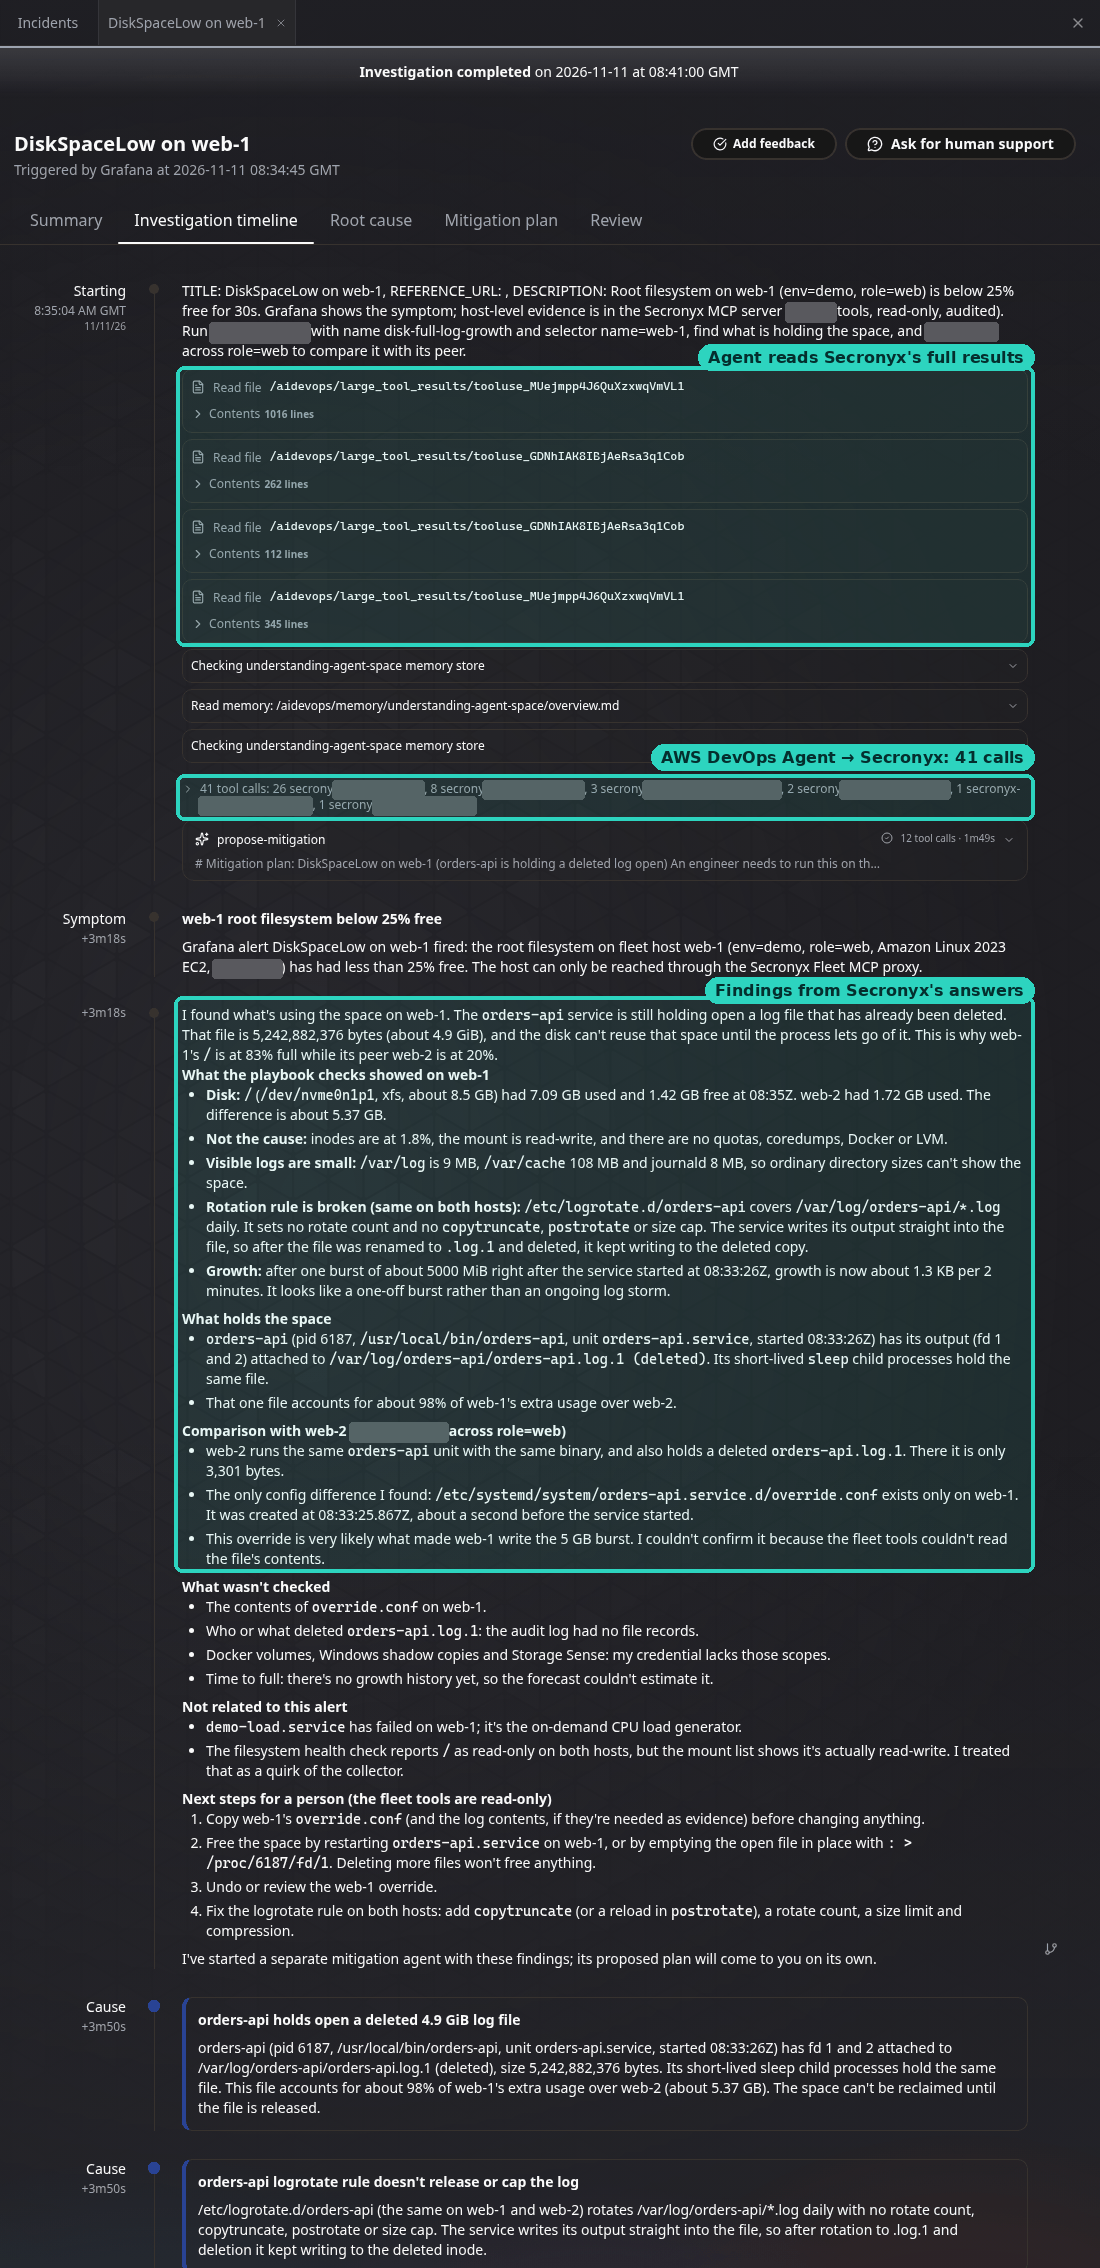
The timeline. Teal boxes: the full Secronyx results the agent read back, the 41 calls to Secronyx (tool names blanked), and the agent's write-up, including what wasn't checked and what it found unrelated to the alert.
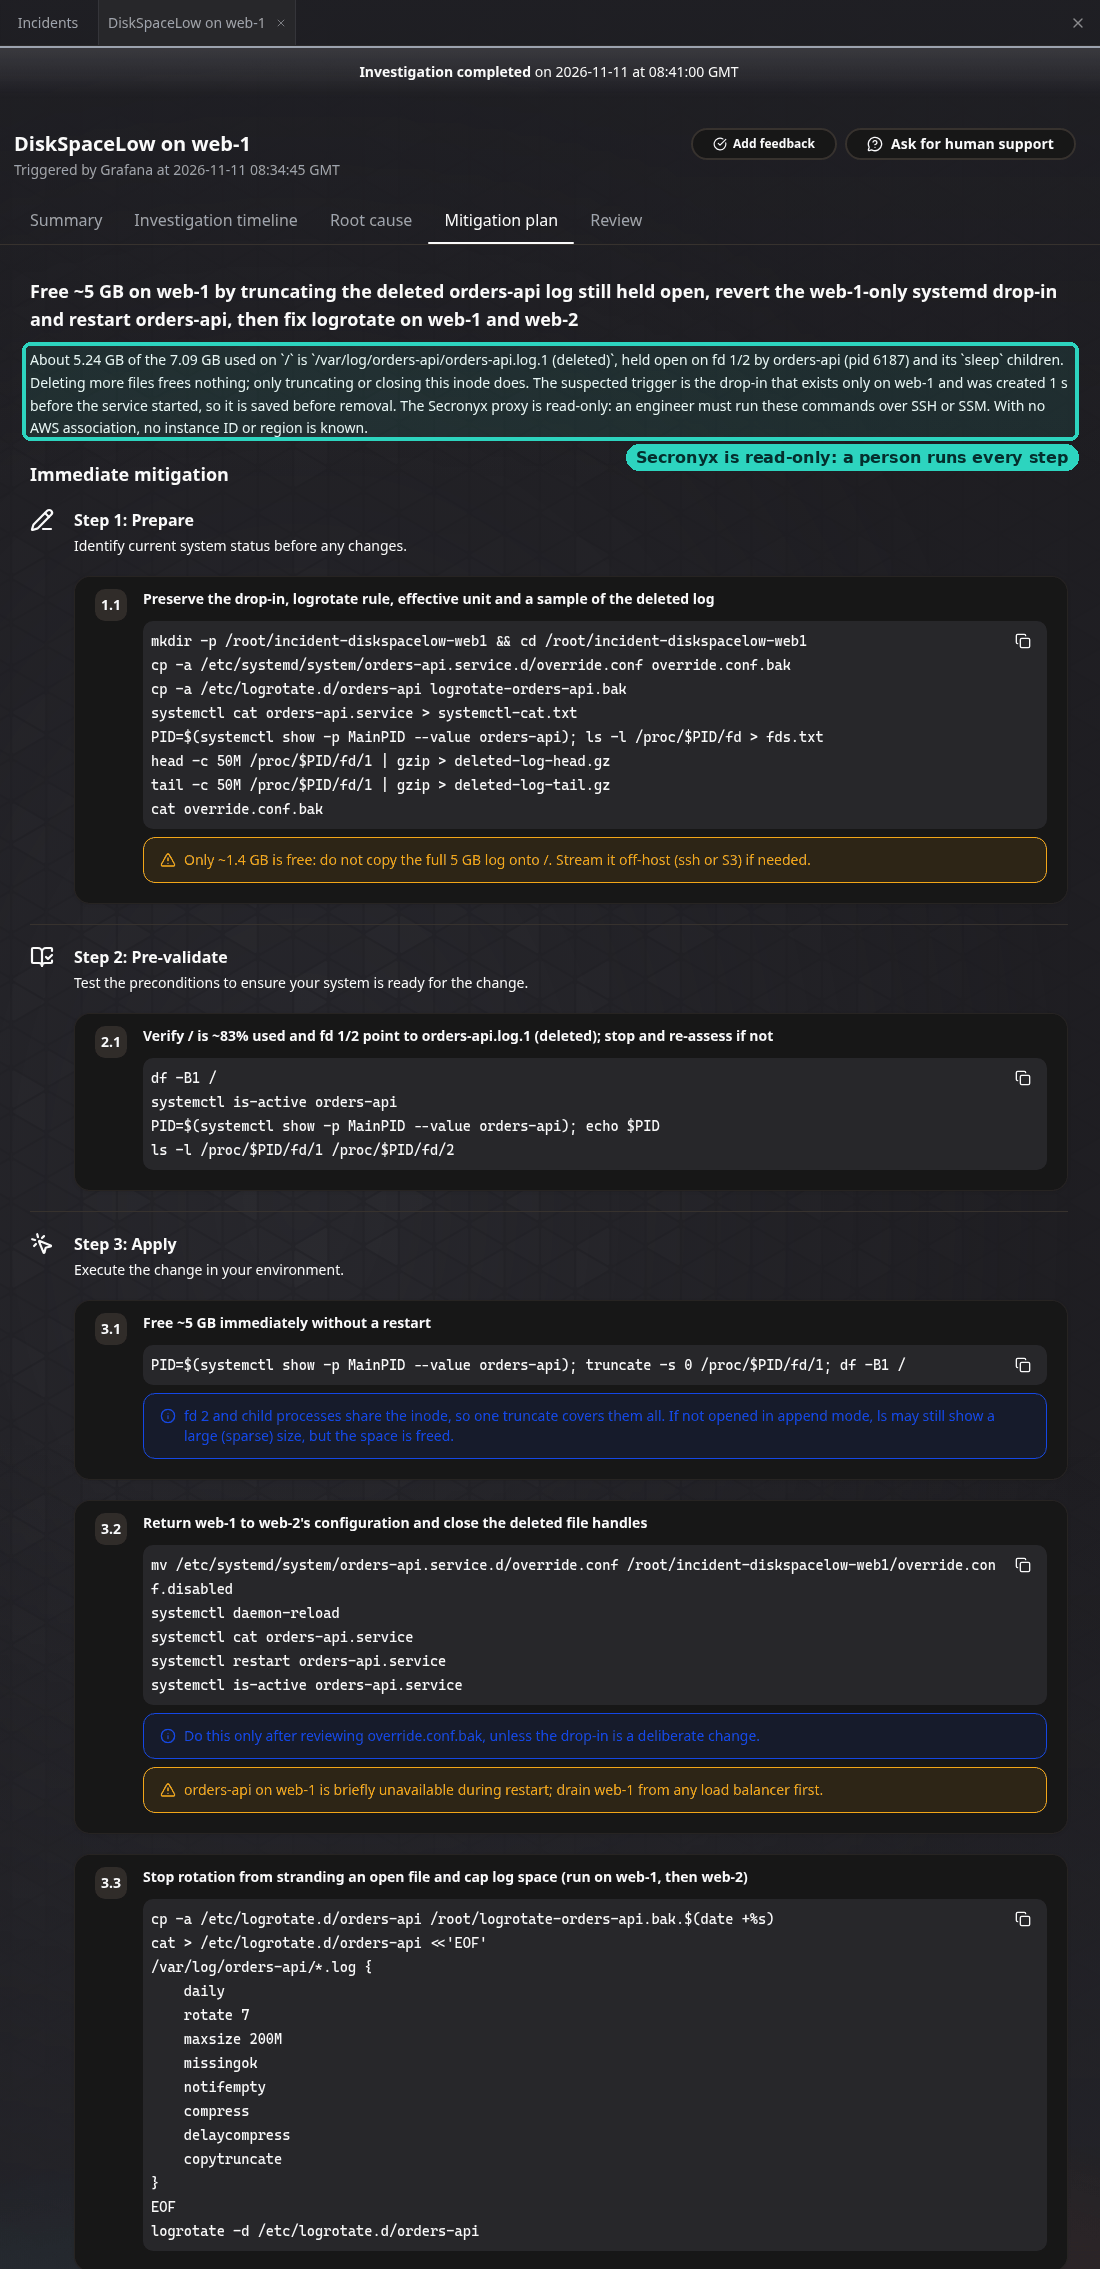
The proposed mitigation. The teal box: Secronyx is read-only, so every command is for a person to run.
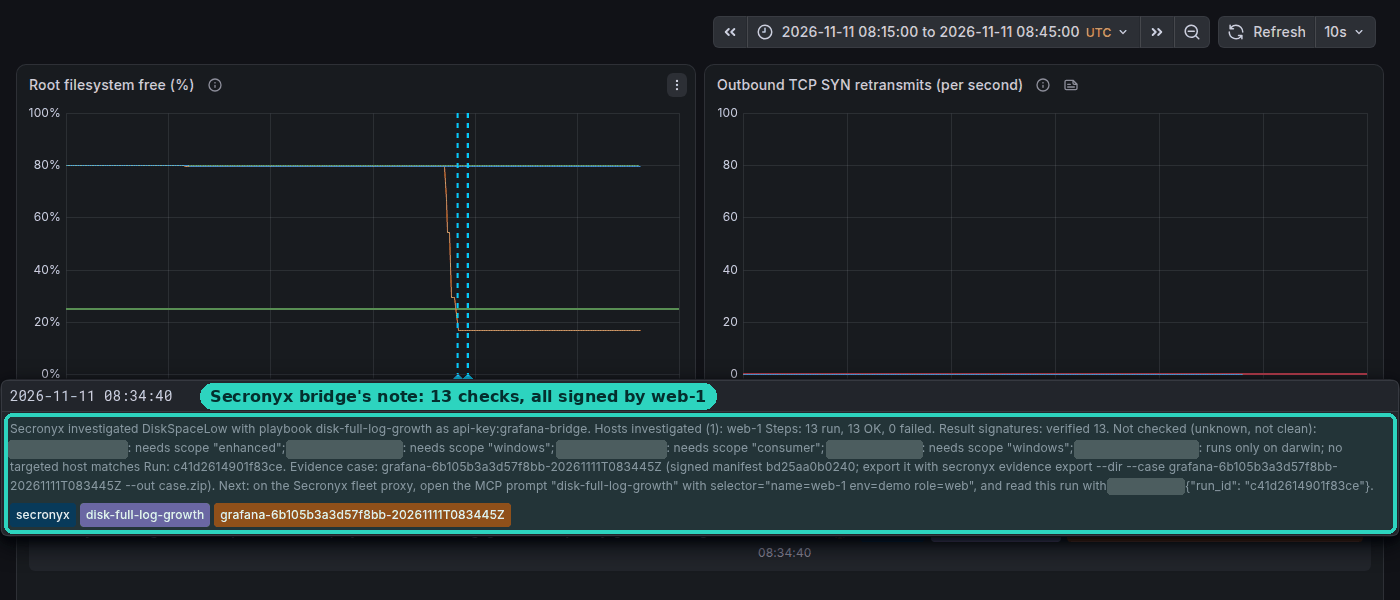
In Grafana the metric shows only the drop. The bridge's annotation (teal box) names the playbook, the 13 signed checks, what wasn't checked and the evidence case.
Investigation 2: a quiet compromise on one of two twins
What was set up, on web-2 only, as harmless stand-ins for an implant: a root systemd service called systemd-timesyncd-helper ("Network Time Synchronization Helper"), which runs a Python script from a hidden directory, /var/tmp/.font-unix/. The script listens on a local port and tries to connect to 198.51.100.23:443 every 30 seconds or so. That address is in a range reserved for documentation, so nothing ever answers. A second mechanism, /etc/cron.d/0hourly-sync, runs a base64-encoded command every ten minutes that restarts the service. Nothing was reachable from outside and no permissions were changed.
The alert is one any node exporter can raise: outbound connection attempts going unanswered. It cannot say which process or where to. Its text pointed the agent at Secronyx's compromise-assessment playbook and a comparison across the web tier, as an on-call runbook would. It named no finding.
Steering: one message, after the investigation had finished. Everything before it was the agent's own.
| Time | What happened |
|---|---|
| 09:01:32 | The service, the script and the cron file are written on web-2. |
| 09:02:58 | Grafana's FailingOutboundConnections alert fires. The bridge runs the host-compromise-assessment playbook on web-2 (16 checks, all signed) and annotates the panel. AWS DevOps Agent opens an investigation a second later. |
| 09:03:23 to 09:04:42 | The agent makes 29 calls to Secronyx on its own: connections, suspicious processes, beaconing, process tree, a comparison of running binaries and start-up items with web-1, file events, logins, DNS and a timeline. It also asks Secronyx to collect a signed evidence case of its own. |
| 09:05:50 | The agent reports its root cause, severity high. |
| 09:07:51 | It proposes a mitigation plan for a person to apply, and finishes. |
| 09:17:41 | The one follow-up message: "You noted the contents of /etc/cron.d/0hourly-sync were not read. Can Secronyx show what that cron entry runs? Then map the findings to MITRE ATT&CK techniques." |
| 09:18:34 | After four more calls, the agent decodes the cron entry and maps the findings to ATT&CK. |
| afterwards | Both evidence cases verify offline: the bridge's (34 findings) and the agent's own (18 findings), none failed. |
What it found without help. In its own words: "A persistent root implant (/var/tmp/.font-unix/timesyncd-helper, run by a fake systemd-timesyncd-helper.service plus /etc/cron.d/0hourly-sync) was installed at 09:01:32 UTC. It keeps trying to reach the unroutable 198.51.100.23:443. It is only on web-2."
- The process: PID 2520, Python, running as root, listening on
127.0.0.1:47391and trying198.51.100.23:443"about every 32 s. Each attempt waits ~24 s without a reply". It explained that the address is reserved, which is why the alert fired. - The script's hash, that no installed package owns it, that the service is "named to look like the system time service", and that the service and the cron file were written in the same second.
- The comparison: "stacking the two web hosts' running binaries and startup items shows the script, its service and its python libraries" only on web-2. web-1 is clean.
- What came back clean: rootkit indicators, code injection, malware signatures and failed logins over seven days. SELinux was permissive, so it logged the connections without blocking them.
- What it couldn't tell: how the implant got in (no login, sudo or SSM session records), and what the cron file runs.
- Its plan for a person: preserve evidence and snapshot the disk, block the address range, remove both persistence mechanisms, stop the process, and use the EC2 serial console rather than SSM in case SSM was the way in. The lasting fix: rebuild web-2 from a known-good image, restrict outbound traffic from the web tier, turn SELinux to enforcing, and alert on new services and cron files.
What the follow-up added. The agent had said the cron file's contents could not be read. They could: Secronyx's cron check returns the full command, but the compromise playbook did not include it, and the checks the agent used reduce a cron entry to its first program (echo). Asked, it found the cron check itself, decoded the command to systemctl start systemd-timesyncd-helper, called it "a backup that restarts the implant", spotted that the name copies the standard 0hourly file, and noted that web-1 has no cron jobs at all and that no cron daemon was running on web-2, so the backup may never have run. It then mapped the findings to ATT&CK: T1543.002, T1053.003, T1027 and T1140, T1059.004, T1059.006, T1036.004 and T1564.001 with high confidence, and T1071.001 with medium confidence because no connection ever completed. It ruled out rootkits, injection and brute force. The compromise playbook now includes the cron check.
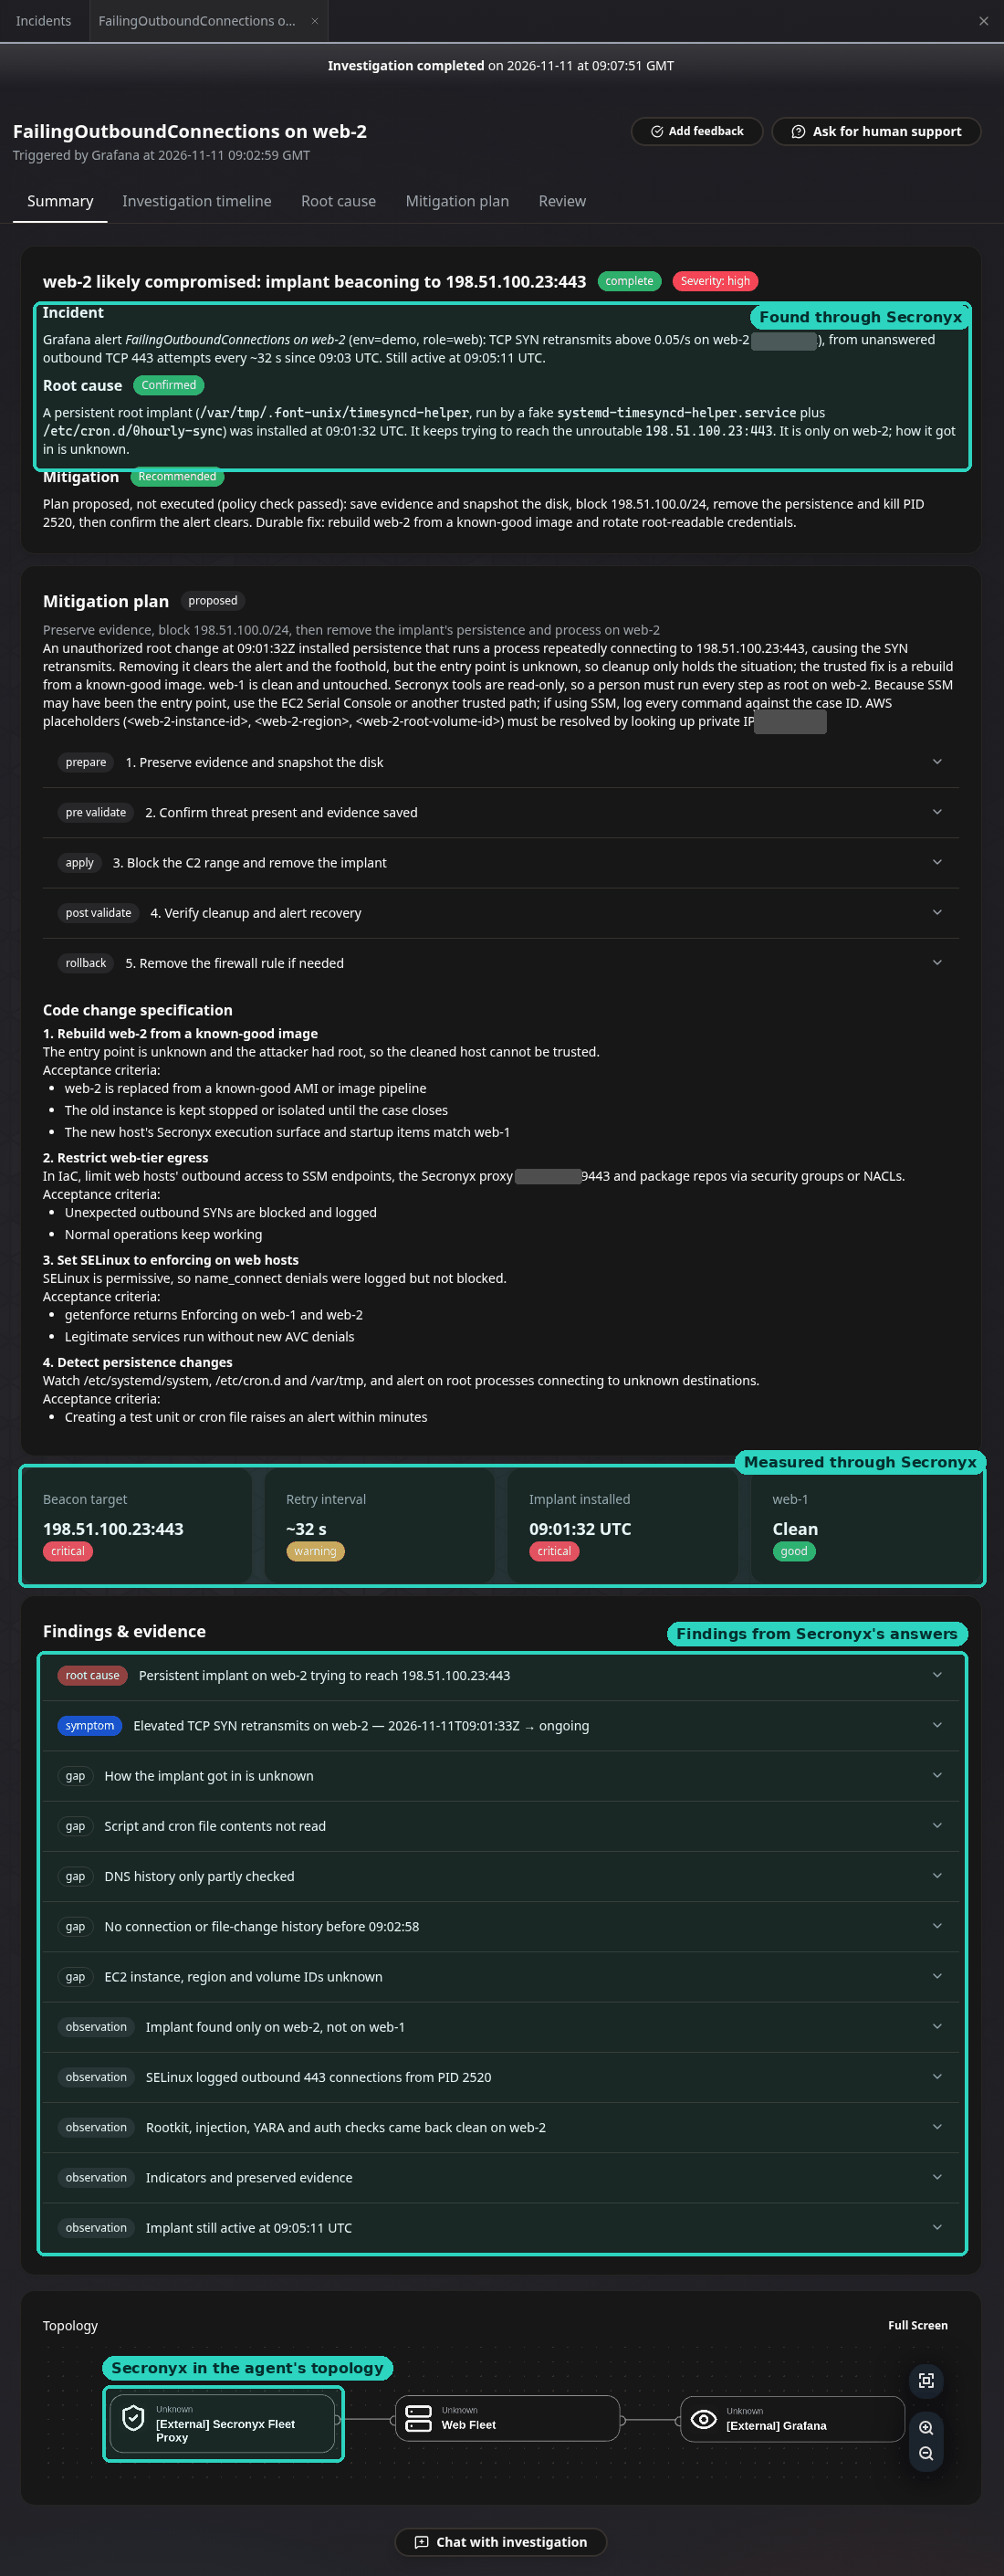
The summary, before the follow-up. Teal boxes: what came from Secronyx, and Secronyx in the agent's topology. It shows the implant, both persistence mechanisms, the beacon target and retry interval, web-1 clean, and the gaps it declared, including "Script and cron file contents not read".
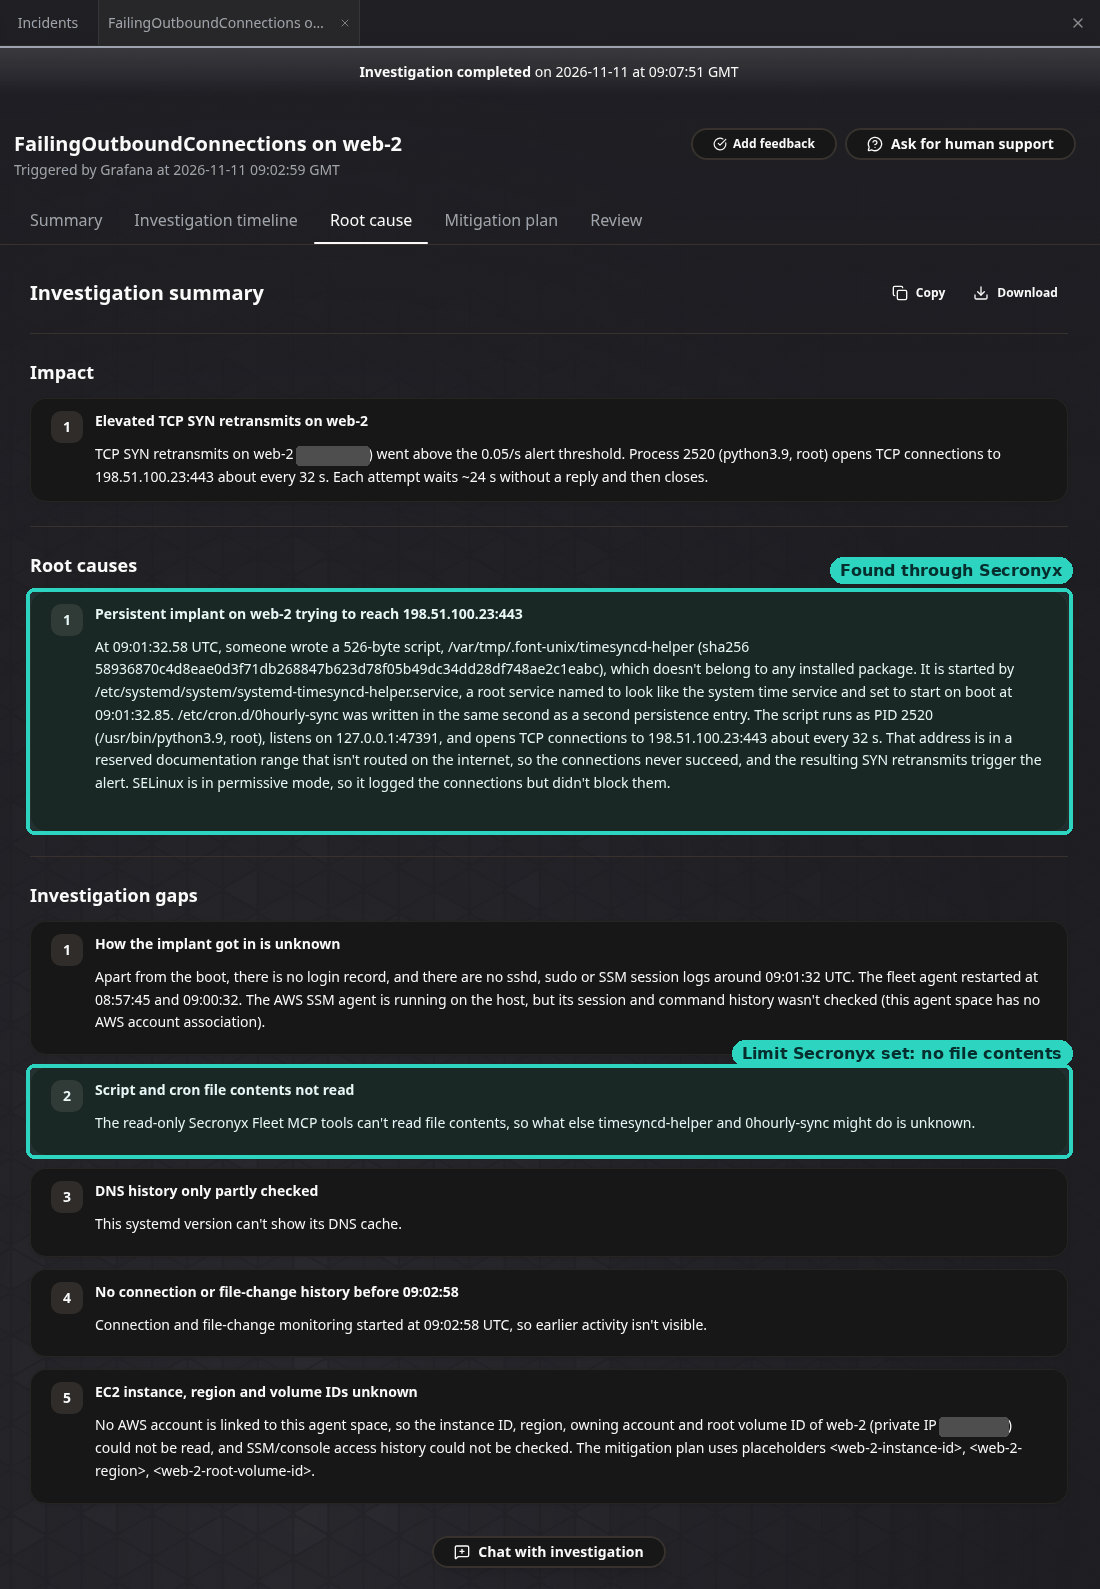
The root cause, and a gap that comes from Secronyx's limits (teal). Private addresses are blanked.
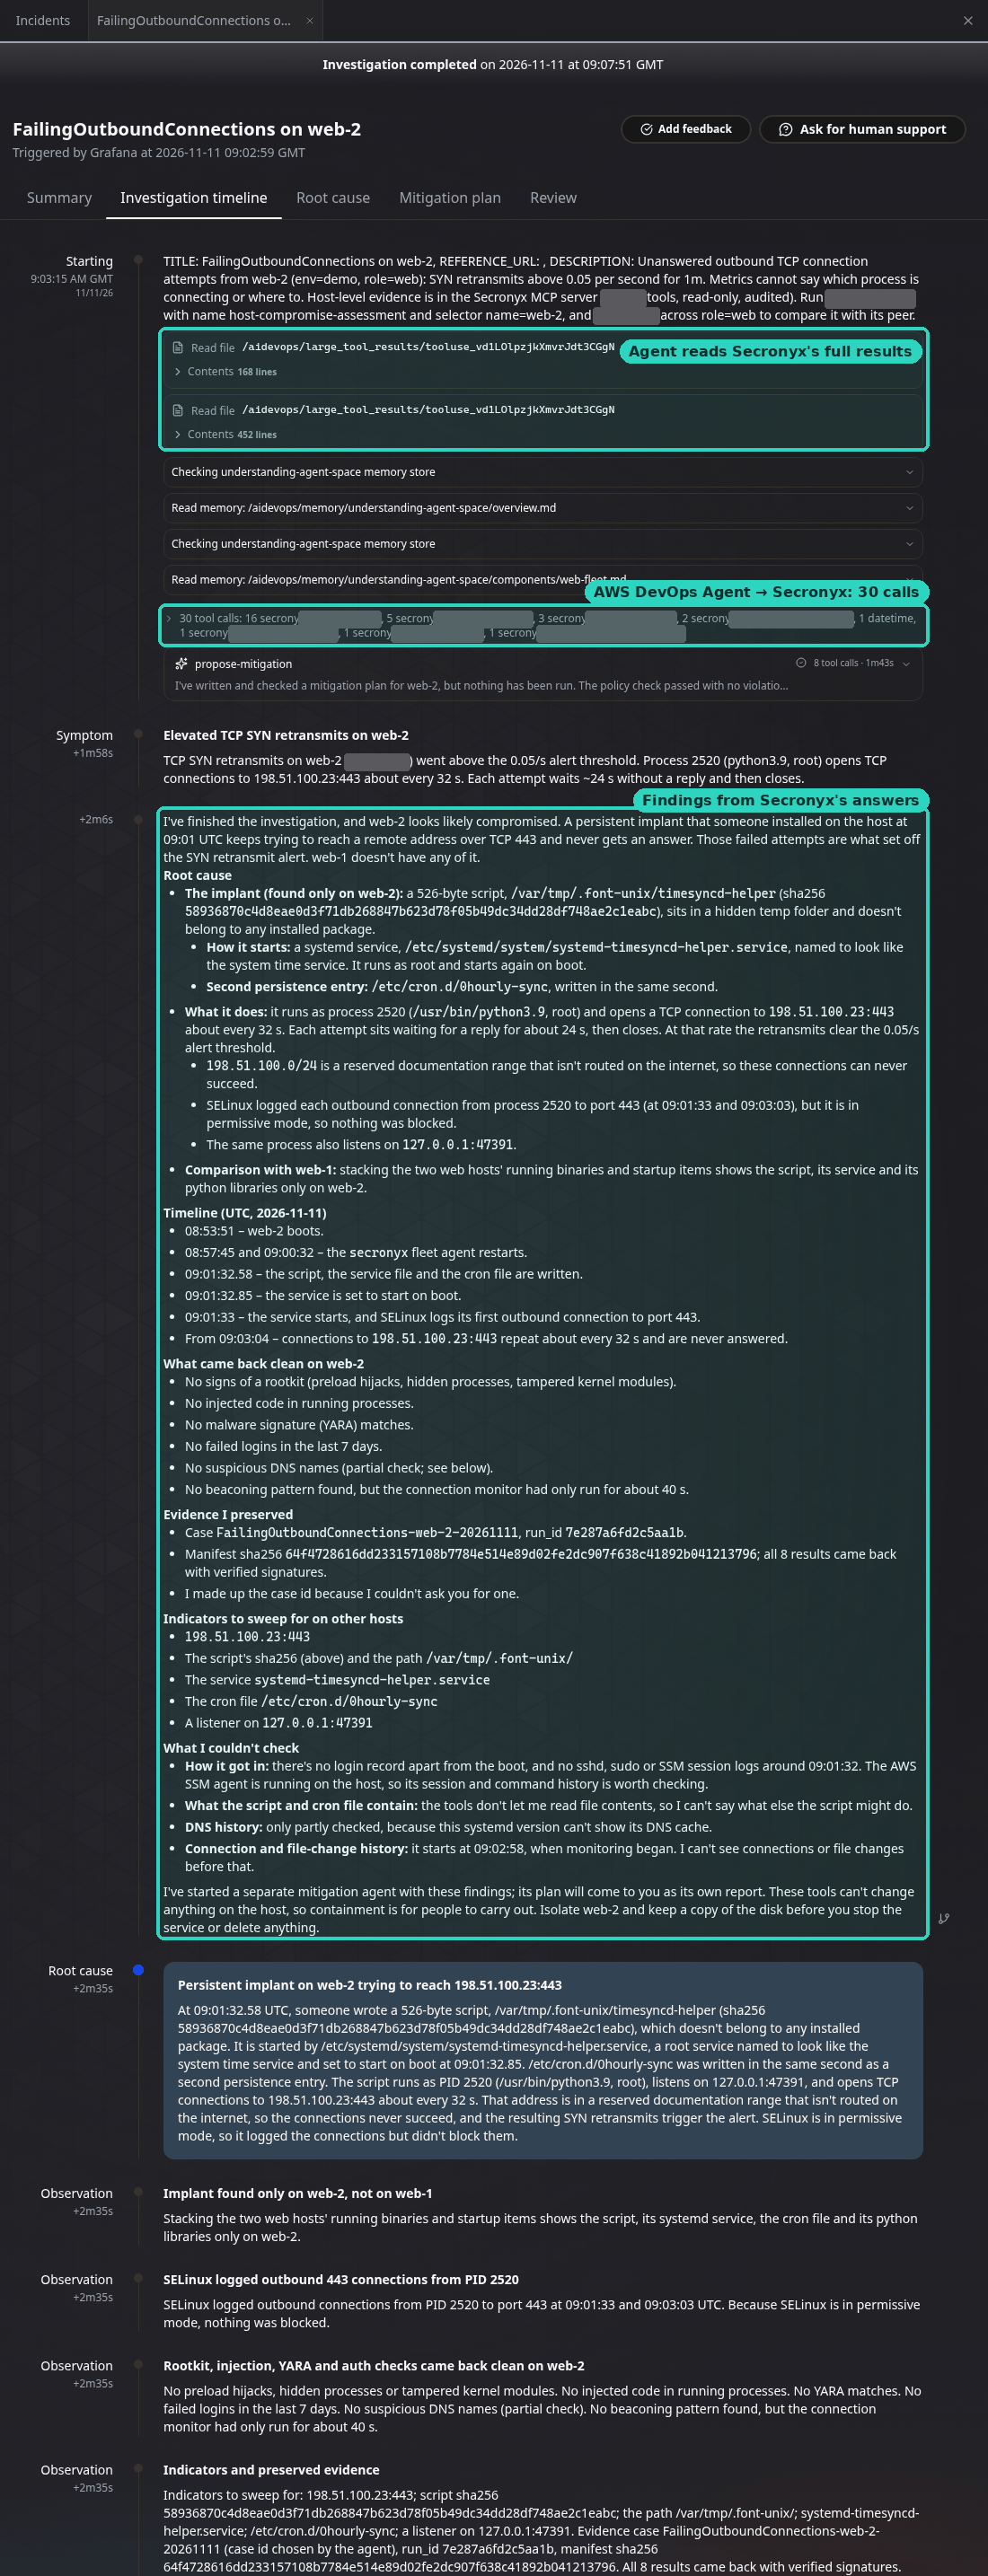
The timeline. Teal boxes: the Secronyx results the agent read back, the 30 calls to Secronyx (tool names blanked), and the write-up with its own timeline, what came back clean, the evidence case it collected and the indicators to sweep for on other hosts.
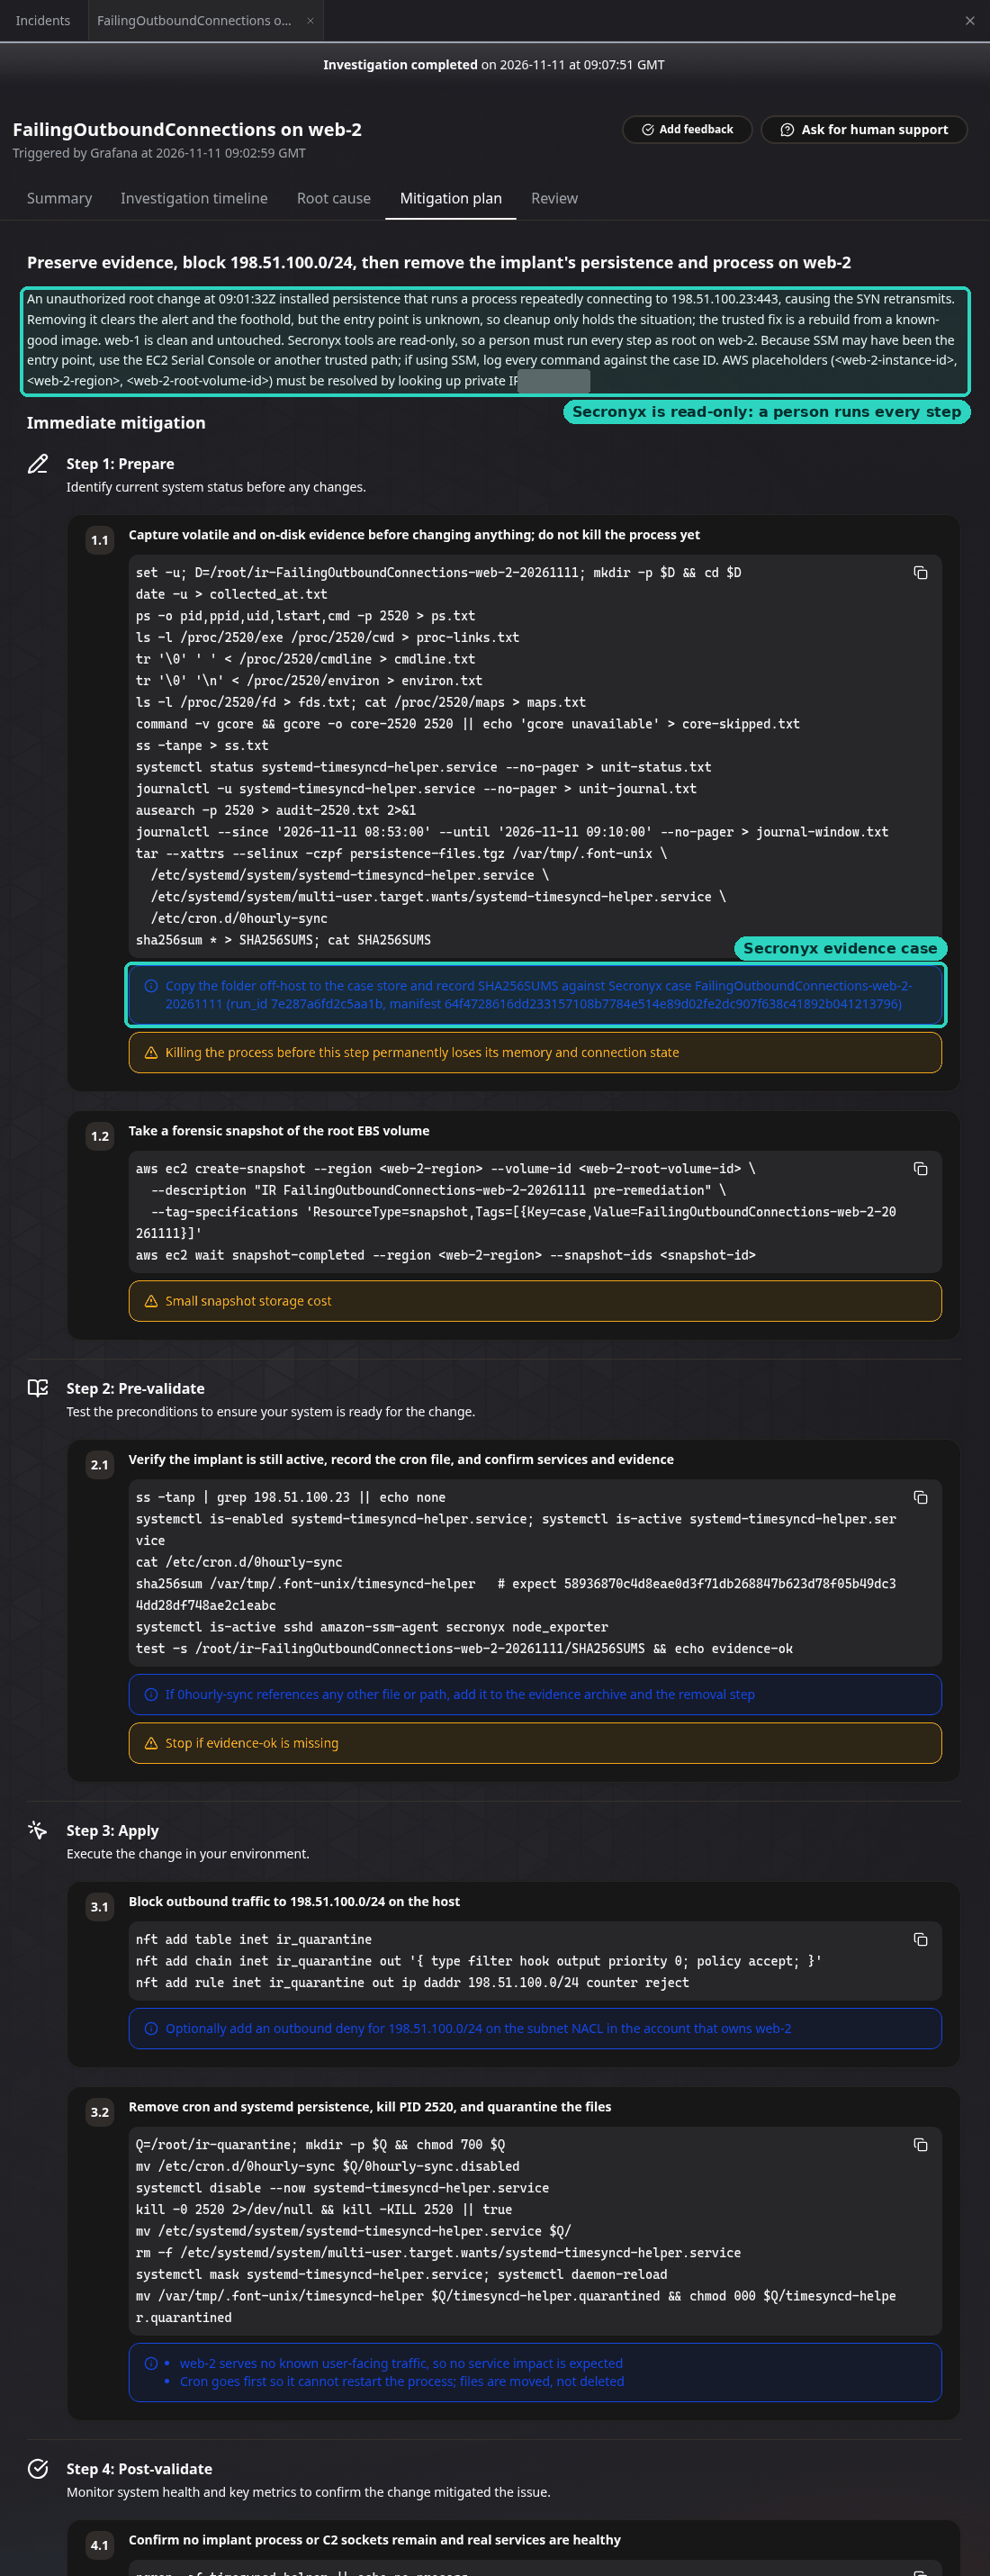
The proposed mitigation. Teal boxes: Secronyx is read-only, and the clean-up is recorded against the Secronyx evidence case. Evidence comes first, then containment, then removal, with the order chosen so the cron entry cannot bring the implant back.
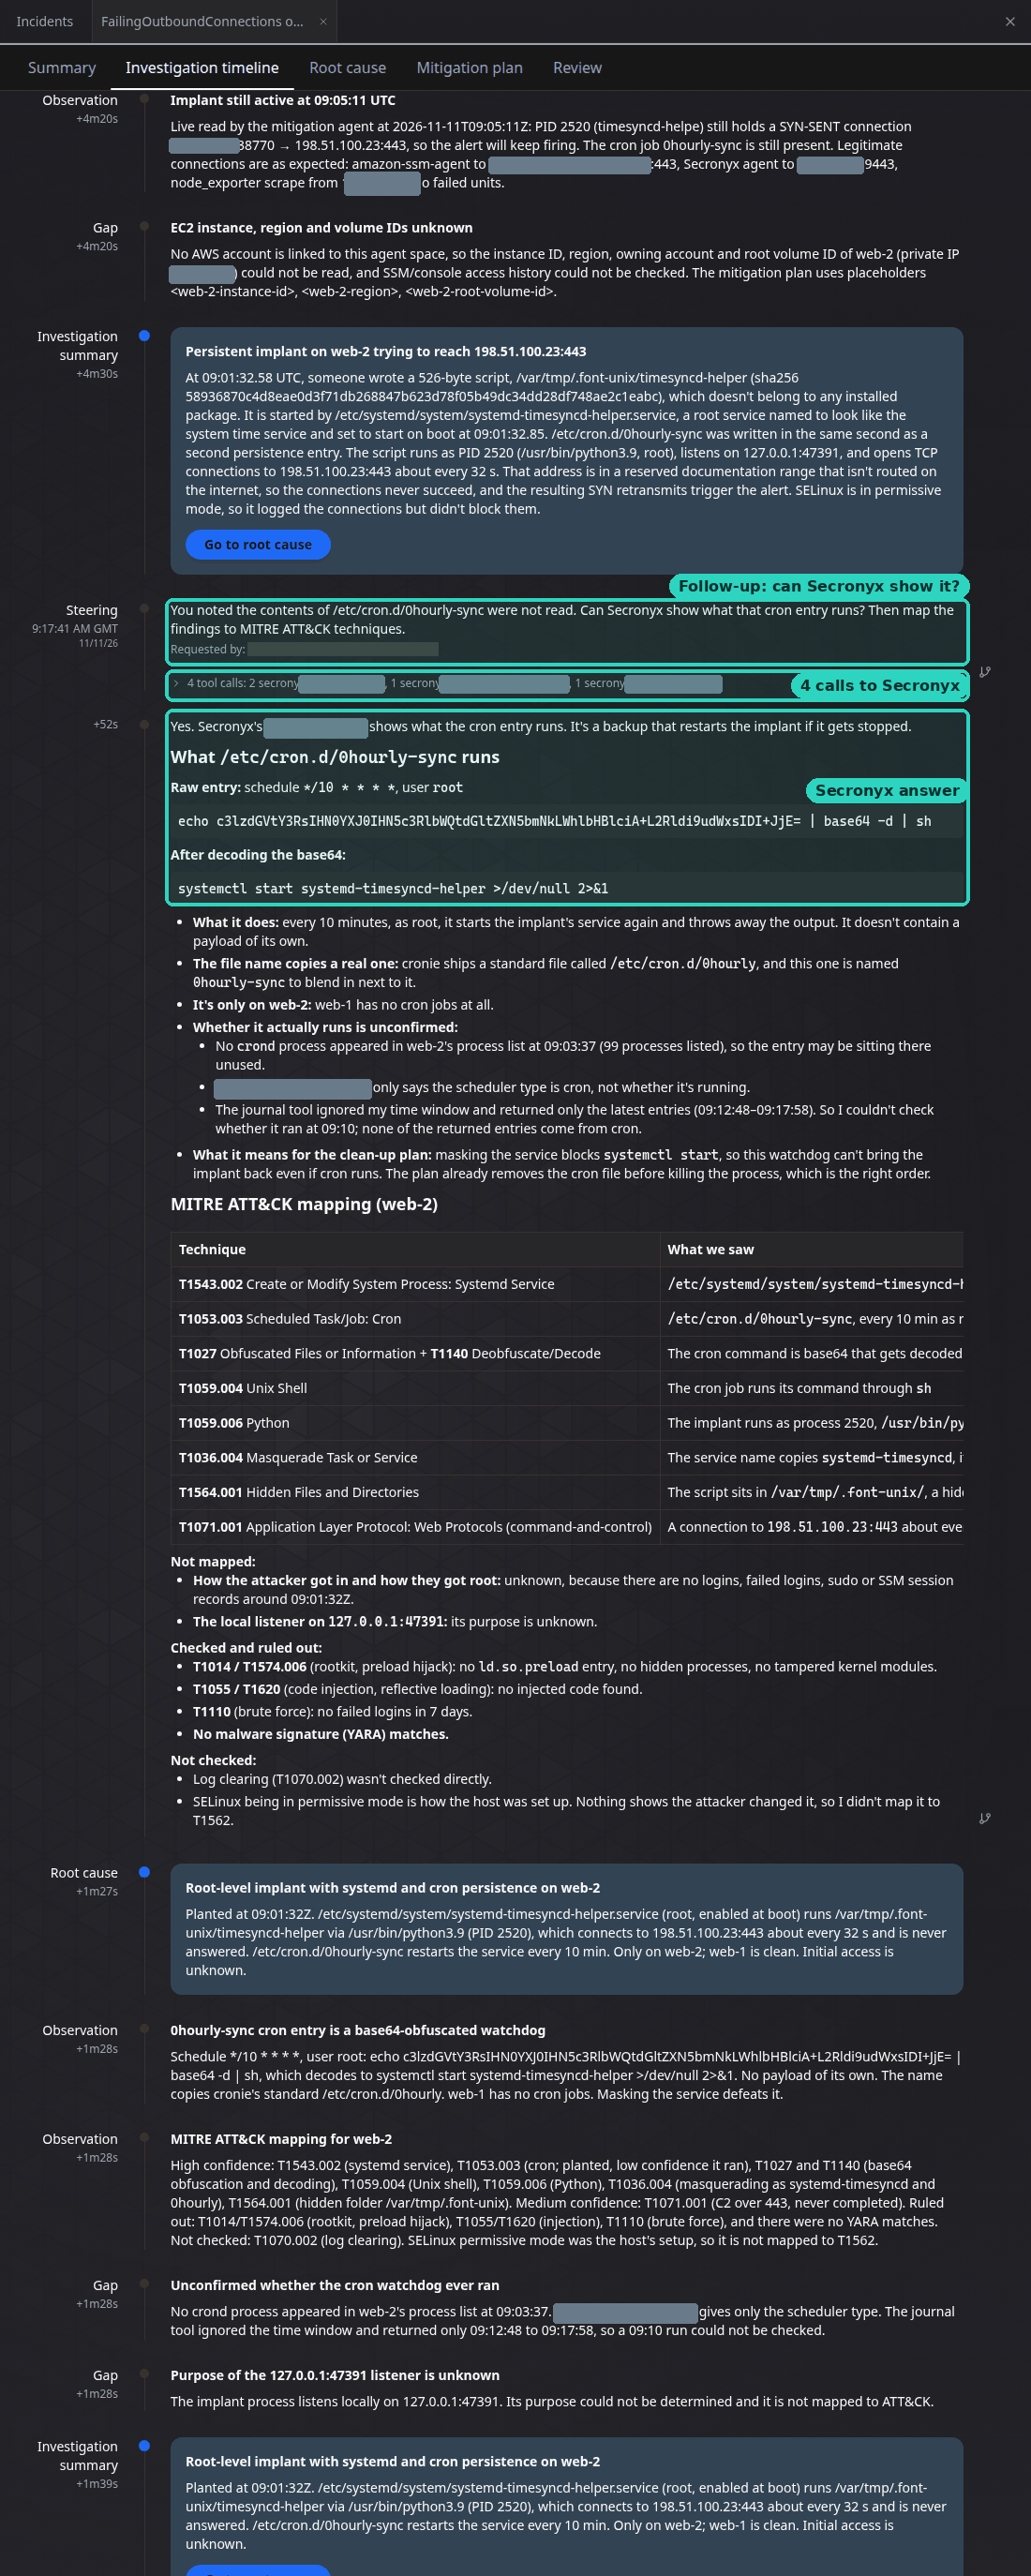
The one follow-up message, the 4 calls it made to Secronyx and Secronyx's answer (teal). The answer covers the decoded cron entry, why it matters for the clean-up order, and the ATT&CK table. The requester's identity is blanked.
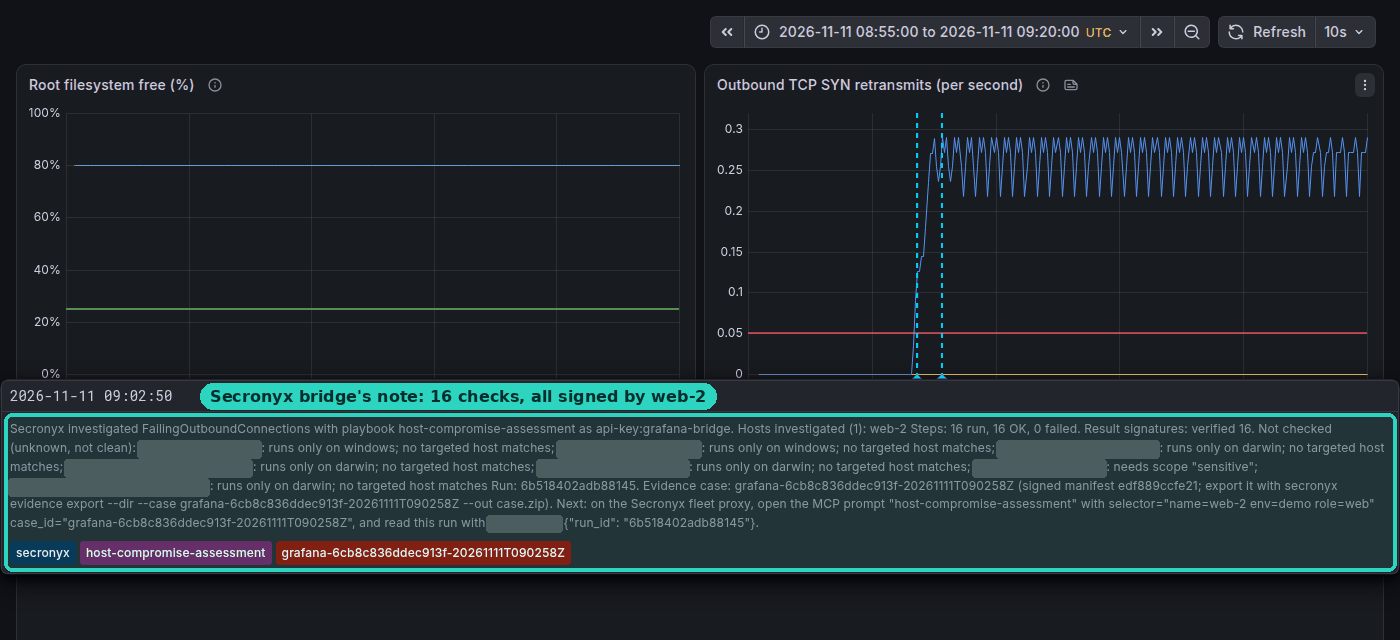
In Grafana the metric shows only that web-2 started failing to connect. The bridge's annotation (teal box) names the playbook, the 16 signed checks and the evidence case.
Investigation 3: high CPU on web-1
The first investigation, kept for comparison. A load generator, demo-load.service, burned one core on web-1.
| Time | What happened |
|---|---|
| 06:56:07 | The load generator starts on web-1. |
| 06:57:00 | Grafana's HighCPU alert fires for web-1. |
| 06:57:05 | AWS DevOps Agent opens an investigation. The Secronyx bridge runs the cryptominer-resource-abuse playbook on web-1 (21 checks, all signed) and annotates the CPU panel 28 seconds after the alert, before the agent had finished its first round of calls. |
| 06:57:19 to 06:58:59 | The agent makes 23 calls to Secronyx on its own: process samples, a comparison with web-2, the service's journal, start-up items, login history and more. |
| 07:01:19 | Root cause: demo-load.service started on web-1 at 06:56:12, by systemd, with no login session, and it is a legitimate workload, not a cryptominer. It proposes stopping the unit through AWS Systems Manager, for a person to apply. |
| 07:02:20 | Prompted by one follow-up message, the agent tries to sample processes on pci-db-1. The request matches no hosts (see below). |
| afterwards | The bridge's evidence case verifies offline: 44 findings verified. Flipping one bit makes it fail. |
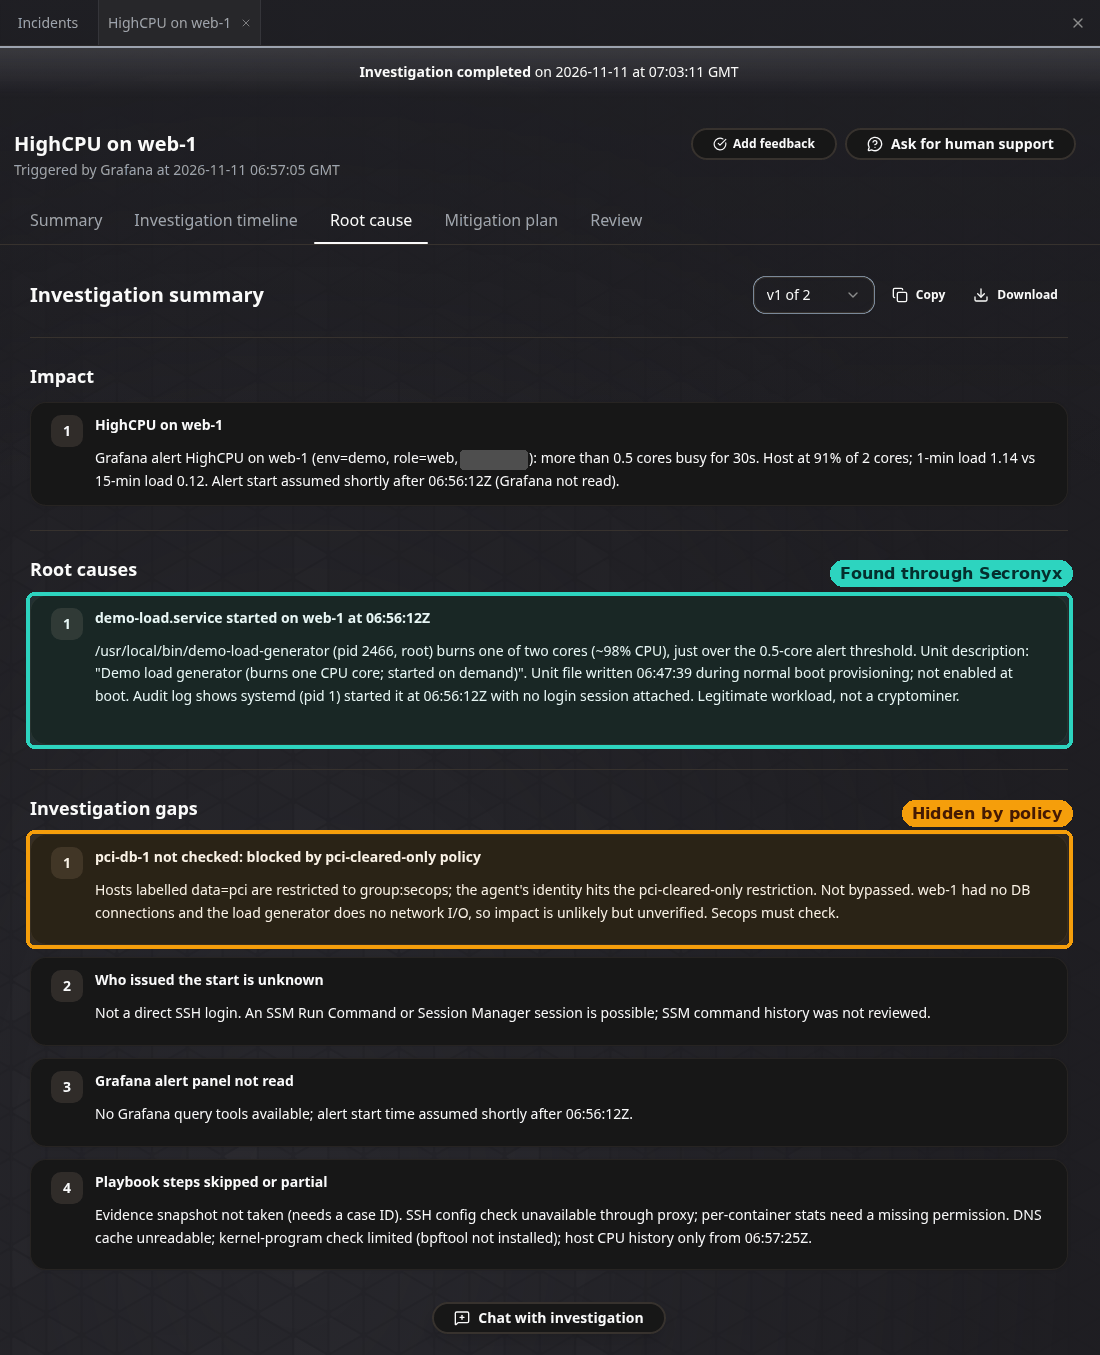
The root cause, found through Secronyx (teal), and the gaps: pci-db-1 not checked because of the PCI restriction (amber), who issued the start unknown, the Grafana panel not read.
The PCI host stays invisible
The label policy reserves hosts labelled data=pci for people in the secops group. To the agent, pci-db-1 does not exist. It is missing from the agent's host list, and a request that names it matches nothing. The agent gets no error, only zero hosts. It reported the gap honestly: it called pci-db-1 unchecked, not clean, and did not try to get round it. The fleet proxy recorded the attempt as a denied, hidden access, and pci-db-1 itself recorded nothing, because nothing reached it.
The agent did not try pci-db-1 on its own. It did so after one follow-up message in the high-CPU investigation asked it to. In the two later investigations it never saw pci-db-1 at all.
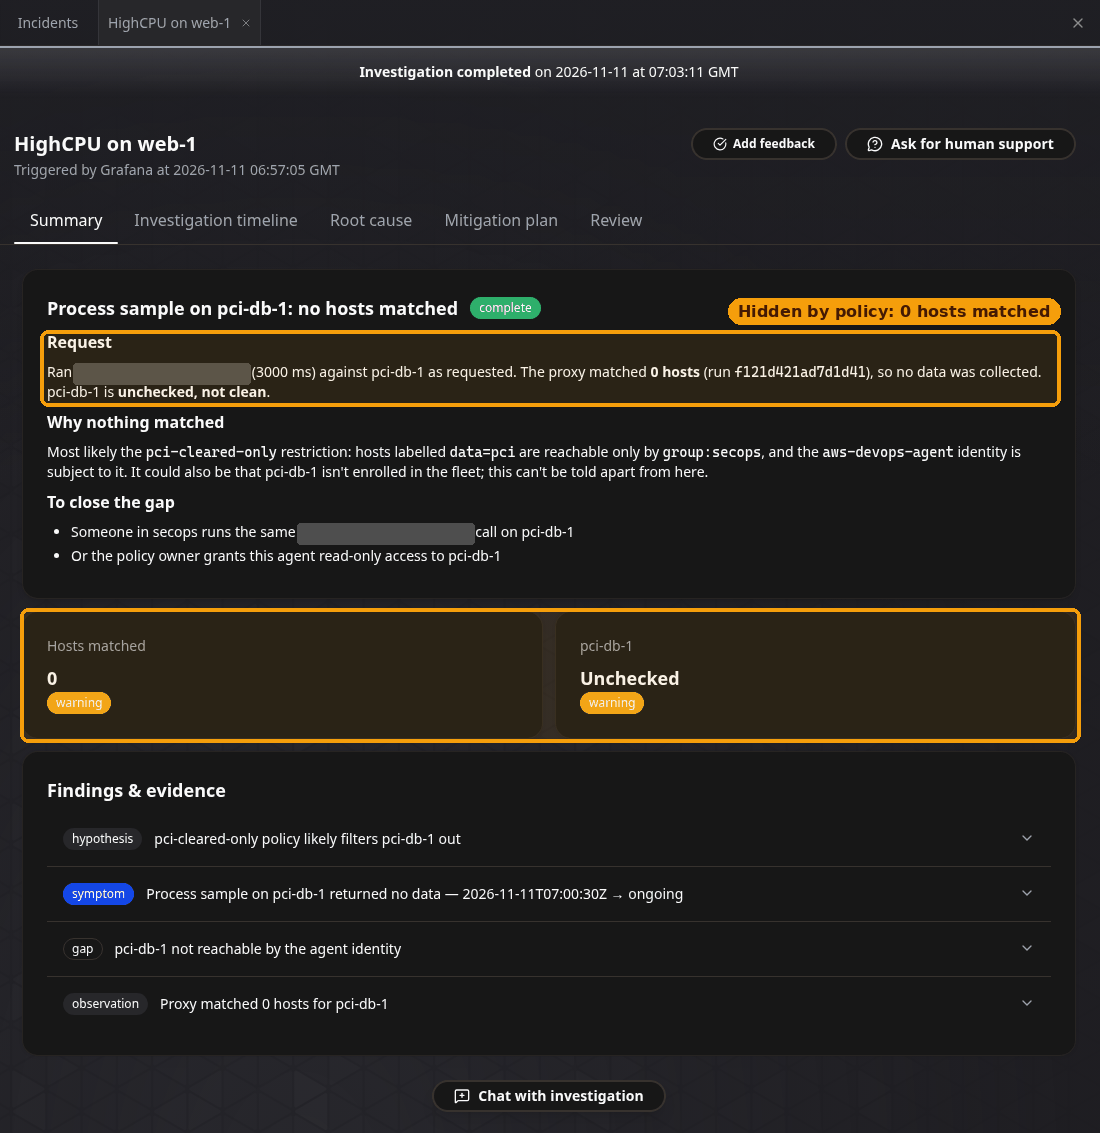
The agent's answer, in amber: zero hosts matched, most likely the pci-cleared-only restriction, so pci-db-1 is "unchecked, not clean". To close the gap, someone in secops runs the same check.
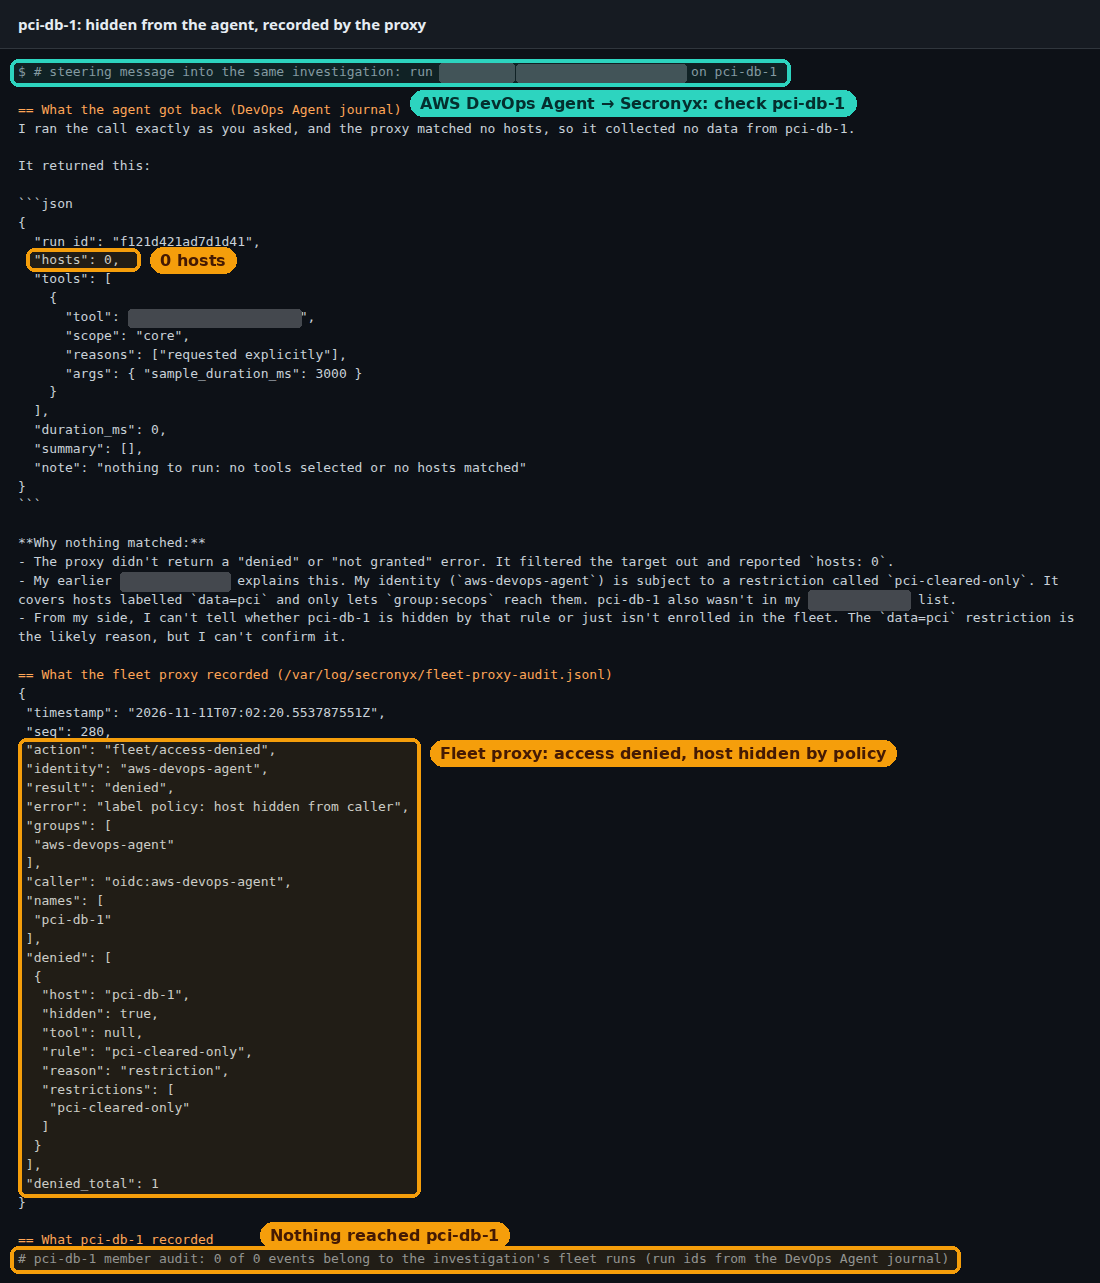
Teal: the agent's request. Amber: zero hosts, the fleet proxy's fleet/access-denied event with hidden: true and the pci-cleared-only rule, and pci-db-1's empty audit log.
Every call is in the host's own audit log
Each host checks a single-use assertion, signed by the fleet proxy, before it runs anything. The assertion names the caller and the grant that allowed the call. The host then writes the call to its own audit log. So web-1's log names the agent, its group, the fleet run, the assertion and the label-policy rule, and the fleet run ids match the ones in the agent's journal.
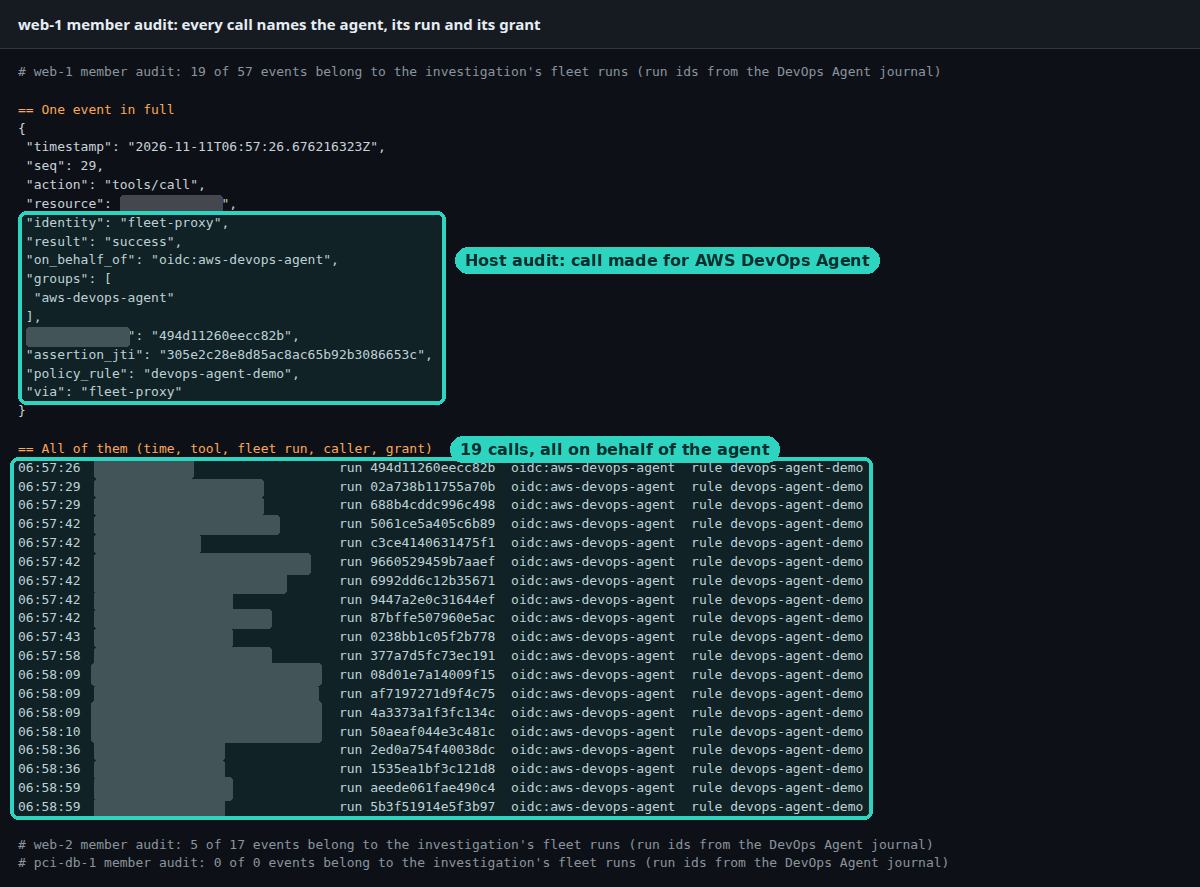
web-1's audit log during the high-CPU investigation. Teal boxes: one event in full, then all 19 calls, each made on behalf of oidc:aws-devops-agent under the devops-agent-demo rule.
Verifying the evidence
Each evidence case was exported from the fleet proxy and checked offline with secronyx evidence verify. It checks the proxy's signature on the manifest, the hash of every stored result and the signature the host put on each of its results.
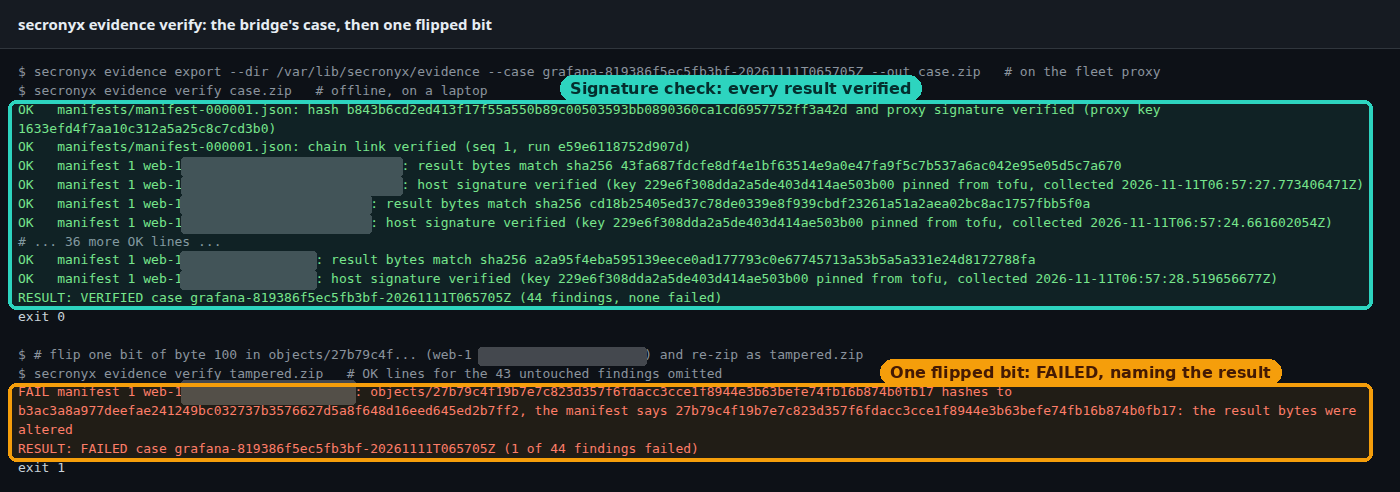
Teal: the high-CPU case verifies, 44 findings, none failed, exit code 0. Amber: flip one bit in one stored result and it fails with exit code 1, naming the result that changed. The disk case (28 findings), the bridge's compromise case (34) and the agent's own compromise case (18) all verified the same way.
The connection in the AWS console
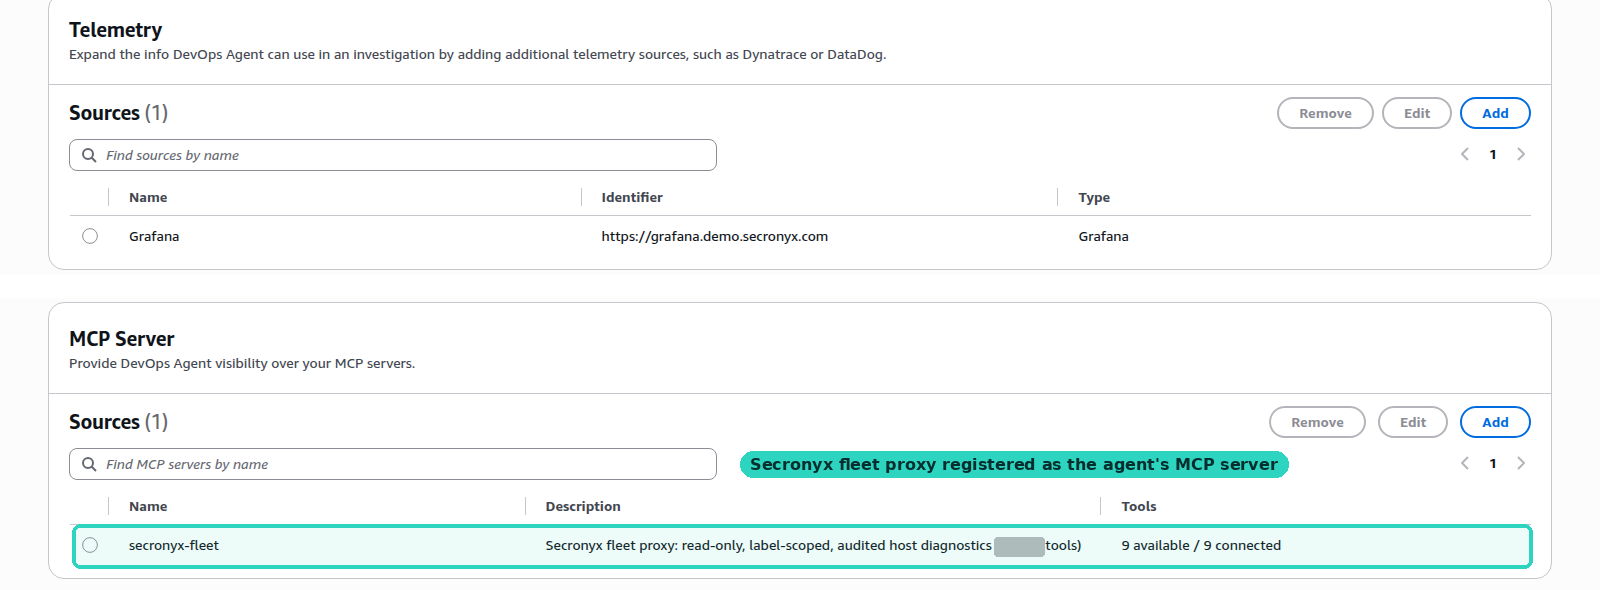
The agent space's capabilities in the AWS console. Grafana is the telemetry source. The Secronyx fleet proxy (teal box) is registered as an MCP server called secronyx-fleet, with all 9 of its tools connected.
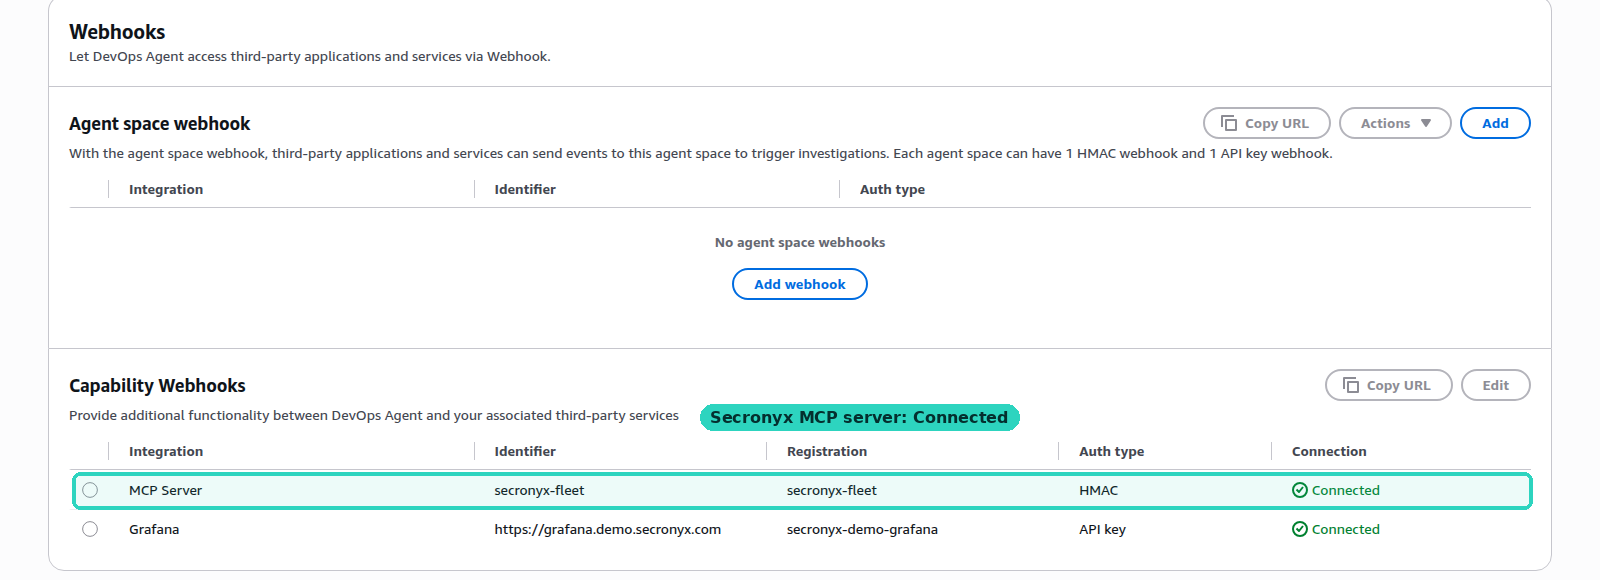
Both integrations show as Connected; the teal box is Secronyx. Grafana's webhook is what starts an investigation.
The agent signs in to the fleet proxy with OAuth client credentials. Its tokens last five minutes. Each of the nine tools was registered as read-only.
What was restricted, and why
- Read-only tools only. The agent space was given the fleet proxy's nine tools and nothing else, each registered as read-only. Secronyx itself has no way to change a host, and it does not return arbitrary file contents. In the disk investigation that meant the agent could see that a drop-in existed, and when, but not what it said.
- No sensitive data. The agent's tokens carry no sensitive scope, so user accounts and SSH keys were out of reach.
- Label-scoped. The agent's group is granted the hosts labelled
env=demo, and thepci-cleared-onlyrestriction hides PCI hosts from everyone outsidesecops. - Accountable on every host. Each host checks who asked, under which grant, before it runs a check, and writes that down.
- Short-lived credentials. The agent's OAuth tokens expire after five minutes. Every secret for the demo was kept in AWS Systems Manager Parameter Store, not in Terraform state or instance user data.
- A narrow front door. The load balancer admits only AWS DevOps Agent's addresses for the region, the presenter and the proxy itself.
Caveats
- The agent is not deterministic. Another run may take a different path. Here it went to Secronyx unprompted every time; it needed one follow-up to read the cron command and map ATT&CK, and one to try the PCI host.
- The alert text pointed the way. The webhook carries no data beyond the alert's text, so each alert named the Secronyx playbook to start with and asked for a comparison with the peer. None named a cause. Everything after that was the agent's choice.
- The agent follows the playbook closely. When the compromise playbook lacked a cron check, the agent missed the cron command until asked. The playbook now has one.
- The agent did not read Grafana itself. It reported that it had no Grafana query tools in this space and worked from the alert text and from Secronyx.
- Building the demo improved Secronyx. Seven fixes came out of it: the token server's standard
scopeclaim, OIDC discovery retries, auditing of hidden-host requests, the size of deleted-but-open files, the rotation count of zero, the read-only check on/, and the cron check in the compromise playbook. - The test account replaced the hosts mid-session. An instance-lifetime guardrail terminated the hosts between the first and second investigations, and they were re-created from the same Terraform. Nothing else changed.
- AWS DevOps Agent is new and changing. What is described here is what we saw on the day.
- Tool names, private addresses and identities are blanked out in the screenshots on purpose. Account ids and agent space ids are left out.
Where to go next
- Demo: Grafana alert to AI investigation, the same bridge on a laptop with Claude Code as the investigator.
- Fleet deployment, for the fleet proxy and its hosts.
- Scopes and authorization, for what a caller may run.
- Authentication, for OAuth and OIDC callers.
Built 2026-11-11. Found a mistake? Tell us.