Demos
Demo: Grafana alert to AI investigation
Grafana can tell you that something broke, but not why. Secronyx looks inside the server, safely, hands the evidence to Claude through Grafana, and proves what both of them saw.
In this demo a Grafana alert goes to Secronyx. Secronyx investigates the alerting host, keeps signed evidence and writes its findings onto the Grafana panel. Claude, an AI assistant, picks up that evidence through Grafana and posts its own verdict on the same panel. It was recorded on 11 November 2026 on a laptop. All times are UTC.
The problem
- Metrics show symptoms, not causes. A graph can tell you a CPU is busy. It can't tell you which process is busy, who started it, or whether it's harmful.
- Giving an AI a shell is too risky. A shell can change anything and read anything. You don't hand that to an AI on a production server.
- There's no trail of what the AI looked at. When an AI reaches a verdict, you need to know what it saw, on which host, and who allowed it.
How it fits together
The Grafana bridge is part of the Secronyx fleet proxy. It doesn't use AI. It follows fixed rules: an alert called HighCPU runs the performance-triage playbook on the host the alert names. Claude comes second, and it reaches the hosts only through the same proxy. Each host signs its answers. The hosts connect out to the proxy, so none of them opens a listening port.
How it's set up
- Install Secronyx on each host. Here that's three containers on one laptop: web-1 and web-2, labelled
env=demo, and db-1, a production host labelledenv=prod. - Run the Secronyx fleet proxy with the Grafana bridge switched on. The hosts connect out to it.
- Write one label rule. The bridge and the AI's group may see
env=demohosts and nothing else. Production is off-limits. - Connect Claude. Claude Code gets two MCP servers (MCP is the protocol AI assistants use to call tools): Grafana's own, and the Secronyx fleet proxy. Its built-in tools, including the shell, are switched off.
- Point the Grafana alert at the bridge. Grafana's key can deliver alerts and do nothing else.
The story: a busy CPU on web-1
At 06:37:10 Grafana's HighCPU alert fired for web-1 only. Something was burning one CPU core. We had started it on purpose: a yes process under a time limit.
Eleven seconds later the bridge had run the playbook's 21 read-only checks on web-1. All 21 results were signed by web-1. It saved them as an evidence case and wrote a note onto the CPU panel at the moment the alert started.
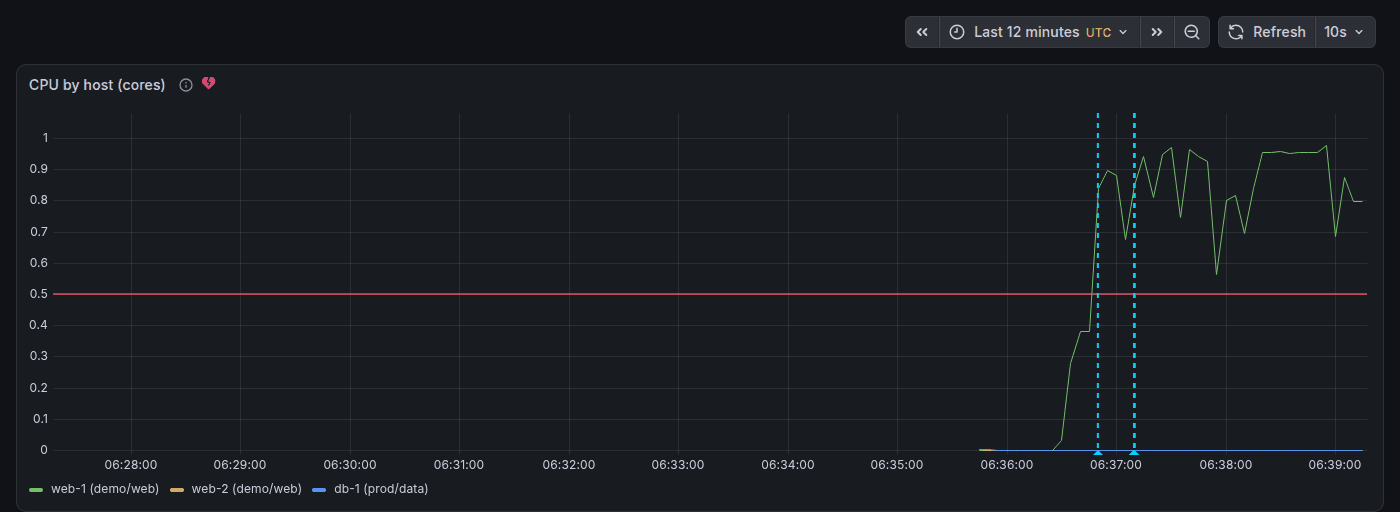
web-1 crosses the 0.5-core threshold. The markers show the alert going to Pending, then firing. The bridge's note and the AI's note sit at the same moment.
Then Claude took over. It started from the bridge's evidence, not from a blank page. In nine turns and 68 seconds it:
- read the bridge's note on the panel;
- asked Prometheus when web-1's CPU rose;
- read the bridge's signed results;
- ran two more read-only checks on web-1, the process tree and its network connections;
- posted its verdict on the same panel.
Its verdict: this was expected work. One process, yes, was using 97.5% of a CPU core. It was started by timeout 420 yes, so it would stop by itself after seven minutes. It was started from outside the container, and web-1 showed no unusual network activity.
Claude also said what it couldn't check: whether the yes program was genuine, because that needs a security permission it wasn't given, and who started it.
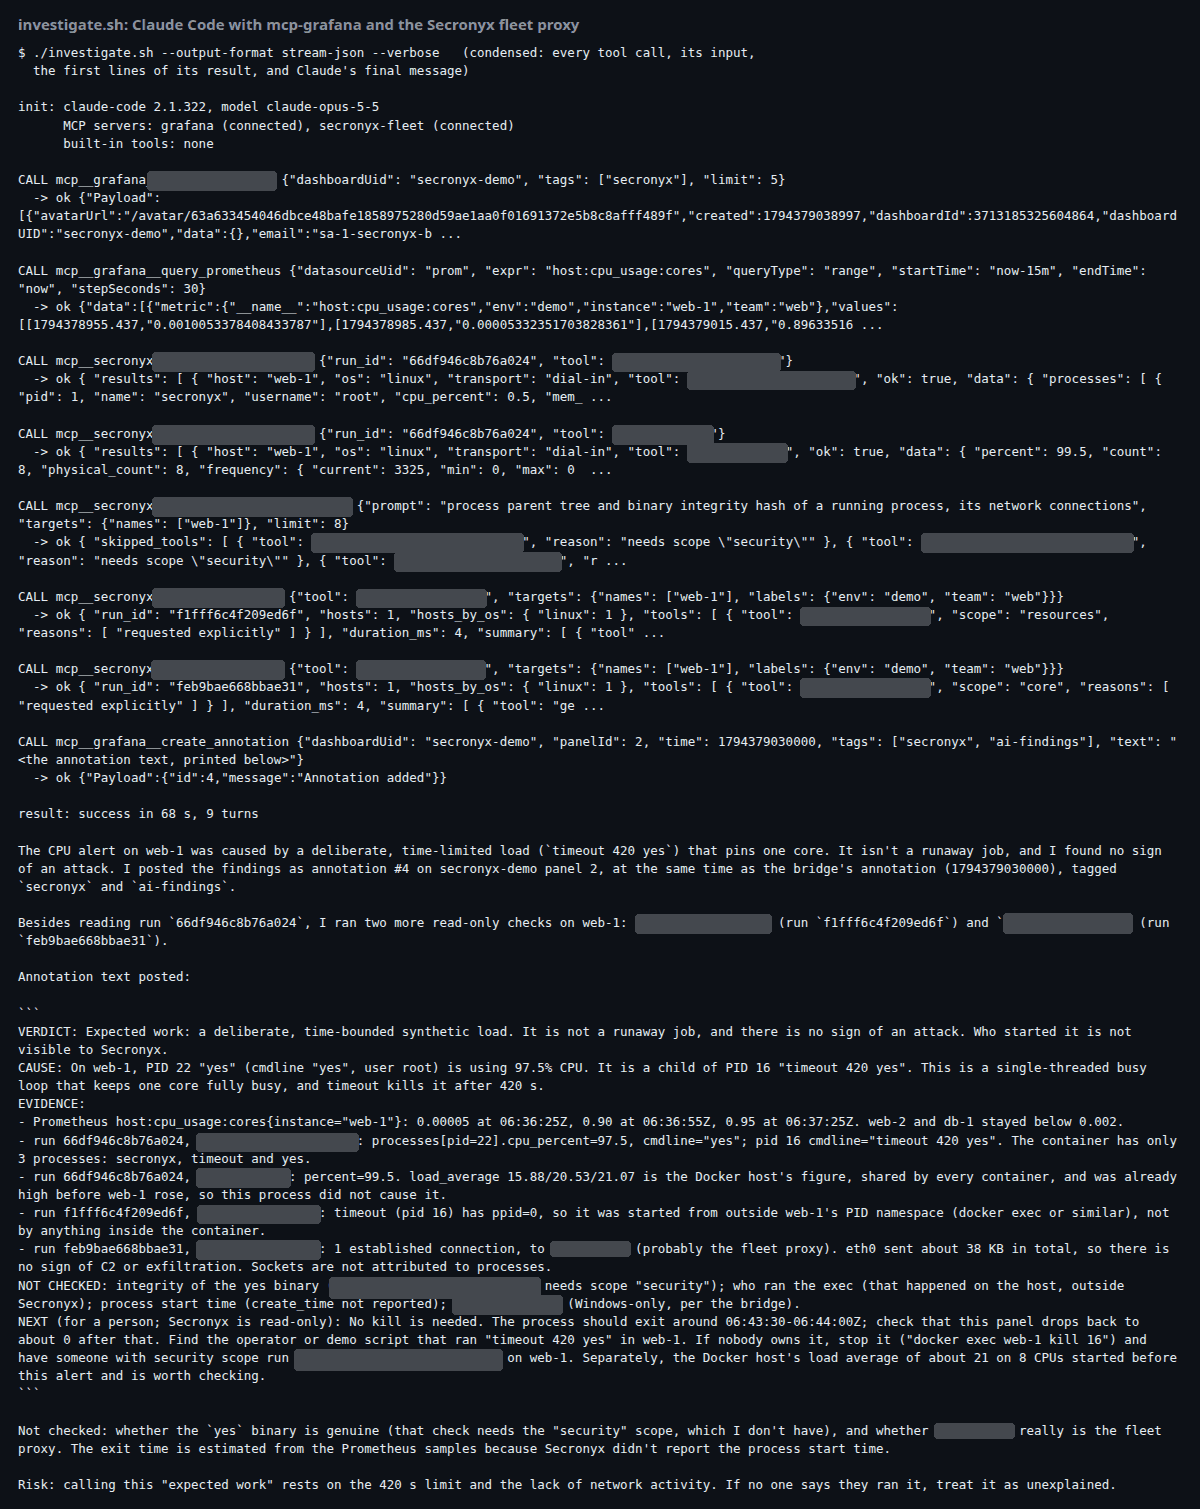
A condensed transcript of the AI step. Its built-in tools are none. Each call is listed with the start of its result, and the run ends with the verdict posted to Grafana.
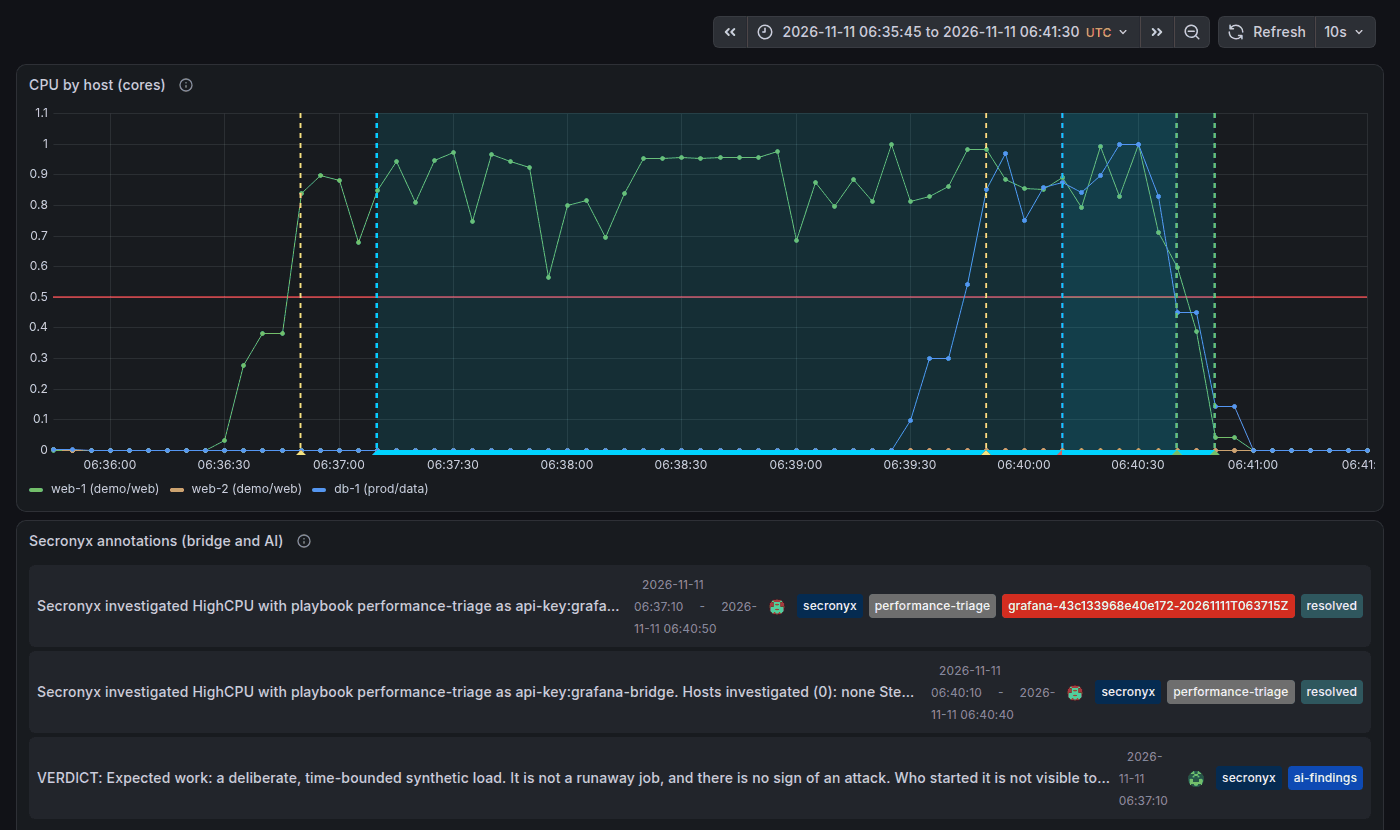
The whole incident in Grafana. The bridge's web-1 note became a shaded region that ends when the alert resolved. Below the graph are the bridge's notes and the AI's verdict.
What Secronyx proves
What the AI actually saw
The fleet proxy keeps a hash-chained audit log: each entry is linked to the one before, so an edit or a gap shows. It records each alert, each decision the bridge took, each request to the hosts, the evidence it saved, every note on the panel, and every call the AI made under its own key.
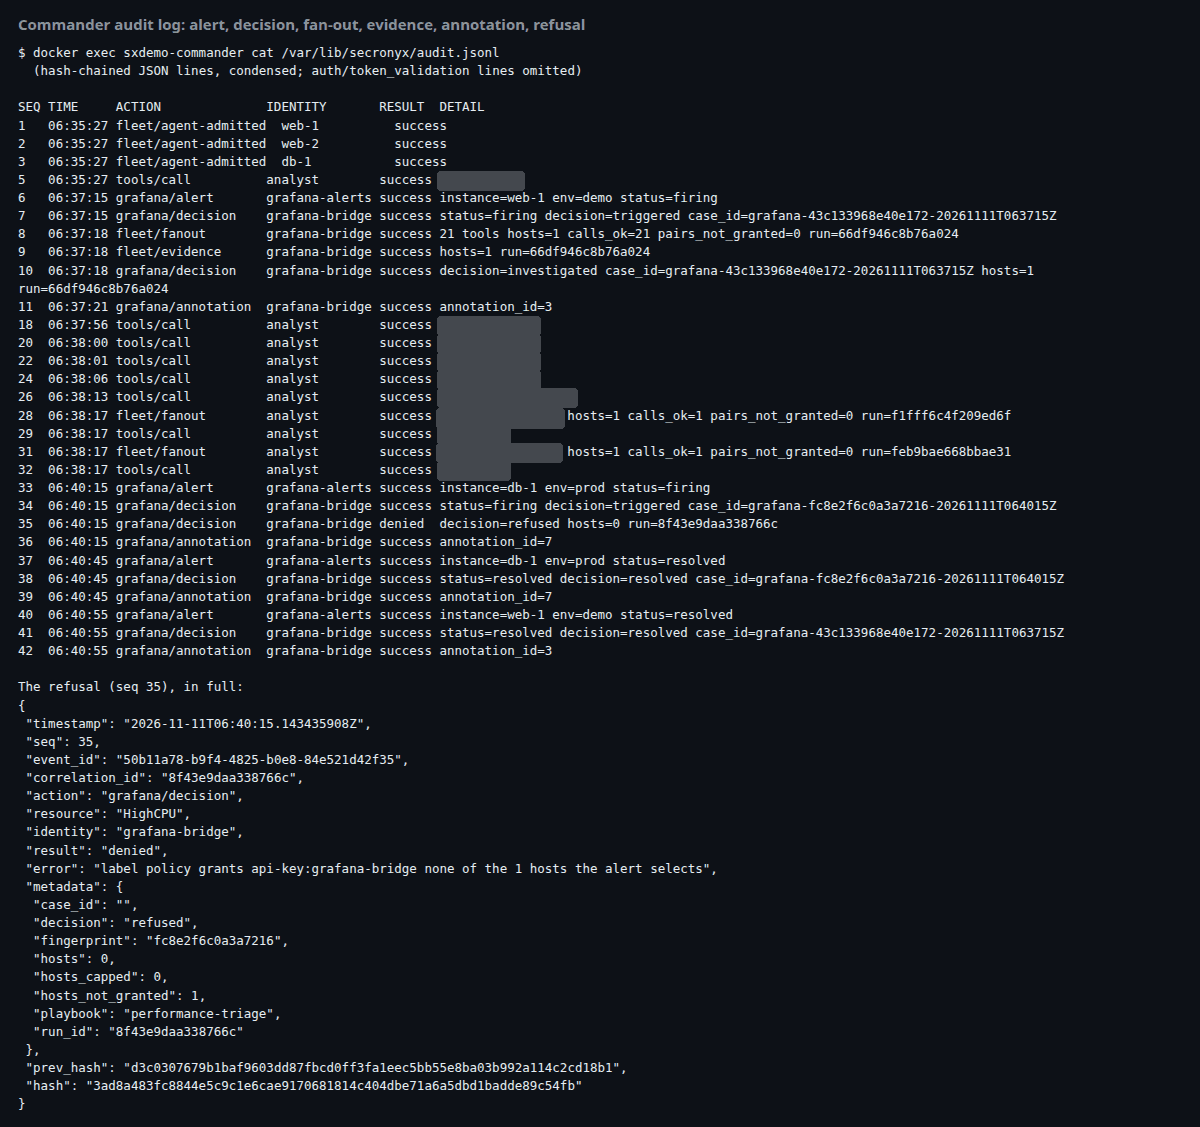
The audit log for the run. Entry 35 is the refusal for db-1, shown in full below the table.
What it wasn't allowed to see
At 06:40:15 a second load fired the alert for db-1, a production host. The bridge isn't allowed to look at production. So it investigated nothing, and it said so on the panel: "Hosts investigated (0)". An alert isn't a way around access control. The label that pages you doesn't decide what Secronyx may look at. The policy does.
Claude was held to the same kind of limit. Checks that need the security permission were refused to it, and it reported them as not checked, not as clean.
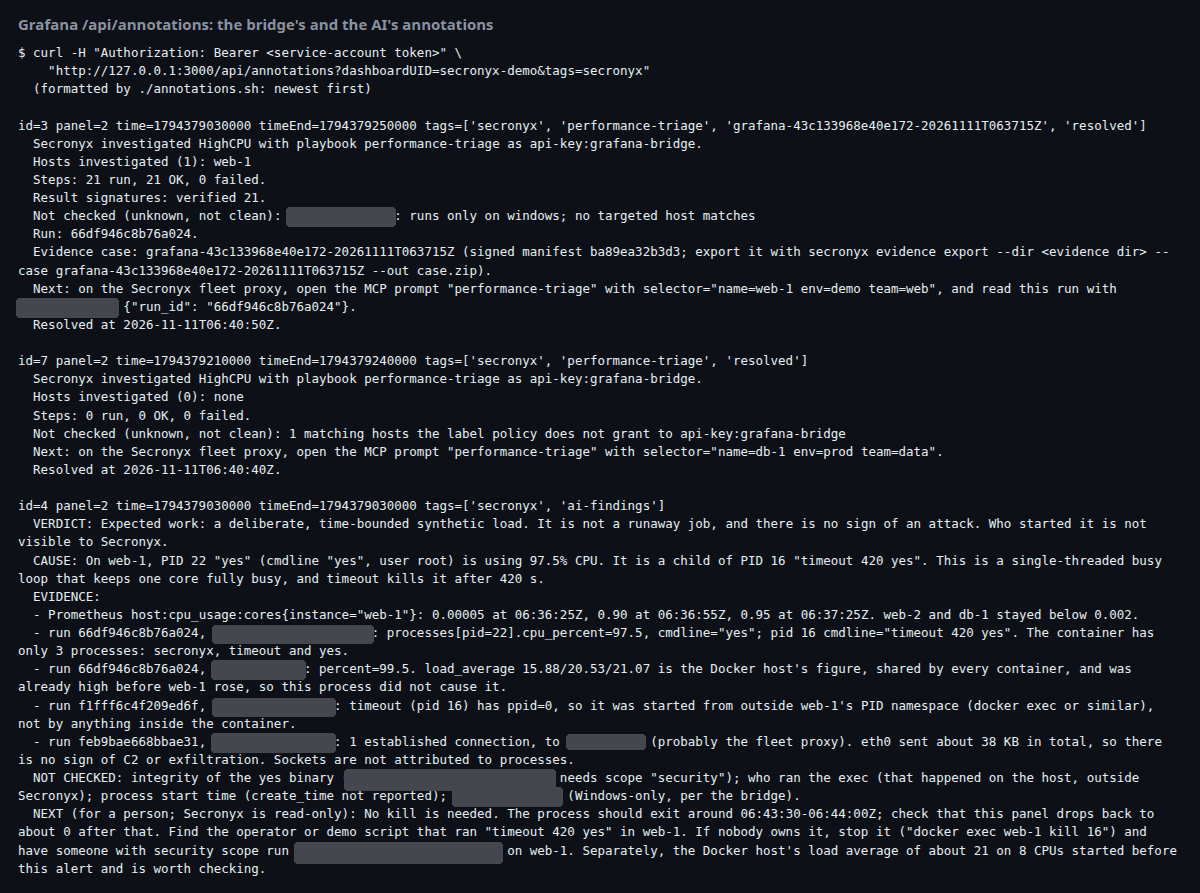
The notes, read back from Grafana. The second entry is the db-1 alert: no hosts investigated, because the policy doesn't grant db-1 to the bridge.
Evidence you can check later
The bridge's evidence case can be exported and checked offline, on any machine, with secronyx evidence verify. It checks the proxy's signature, the fingerprint (hash) of every result and the signature each host put on its own results.
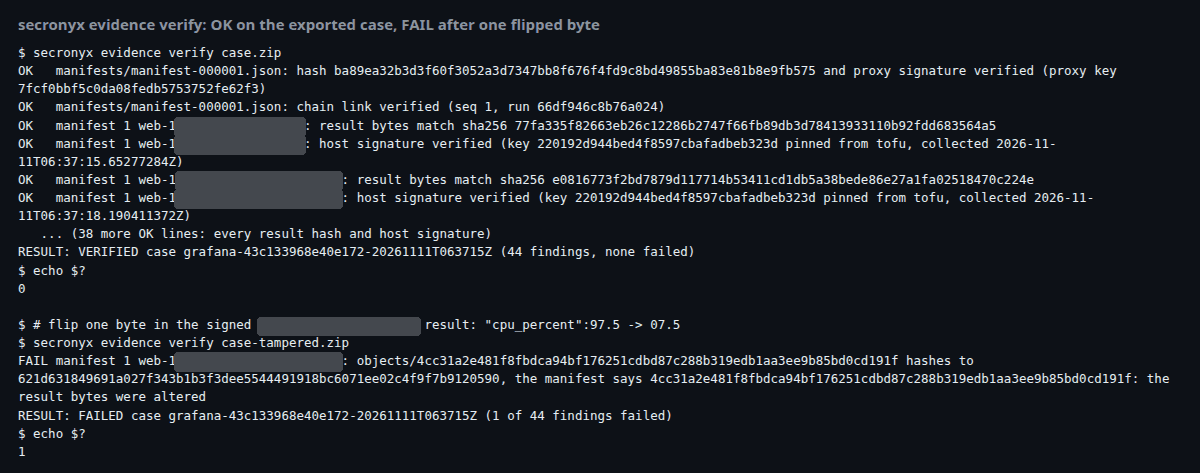
The case verifies: 44 findings, none failed. Change one byte in a signed result, so that 97.5 becomes 07.5, and it fails, naming the result that was altered.
Why not just use your APM?
APM tools such as Datadog, Dynatrace, New Relic and AppDynamics trace requests and chart metrics. Here the metric said one CPU core on web-1 was busy. Secronyx said which process it was, how it was started and that it would stop by itself, from inside the host, on demand, with nothing streamed or stored in the background. For 100 hosts at list prices, Secronyx Pro is £500 a month, against $4,600 to $13,200 for the main APM platforms.
Compare Secronyx with APM, including costs →
The full run log
This page tells the story. The full run log has the minute-by-minute timeline, every screenshot, the restrictions in detail, the caveats and the software versions used.
Try it
- Fleet deployment shows how to run the fleet proxy and connect your hosts.
- Demo: AWS DevOps Agent investigates with Secronyx shows the same idea with Amazon's AI agent and a real AWS fleet.
- Audit logging explains the hash-chained log.
Built 2026-11-11. Found a mistake? Tell us.