Demo · AWS DevOps Agent
Give AWS DevOps Agent visibility inside your servers, without giving it shell access
Secronyx connects AWS DevOps Agent to controlled, read-only diagnostics across your fleet. Every check is policy-restricted, audited on the host and backed by evidence anyone can verify.
AWS DevOps Agent knew web-1's disk was filling up, but the files on disk didn't explain why; through Secronyx it traced 4.9 GiB to a deleted log file still held open by a running service, with no shell access and no changes to the host.
Request accessSee the investigation
This is a recorded run in AWS, not a mock-up. A Grafana alert woke AWS DevOps Agent, Amazon's AI on-call investigator, and it asked Secronyx to look inside the hosts. We recorded it on 11 November 2026 in AWS's London region. All times are UTC.
The problem
- Metrics show symptoms, not causes. A graph can tell you a disk is filling up. It can't tell you which process is holding the space, or why.
- Giving an AI a shell is too risky. A shell can change anything and read anything. You don't hand that to an autonomous agent on a production server.
- There's no trail of what the AI looked at. When an AI reaches a verdict, you need to know what it saw, on which host, and who allowed it.
Why Secronyx alongside AWS DevOps Agent
AWS DevOps Agent
Investigates and reasons. It works across metrics, logs, deployments and AWS APIs. It can also call external MCP servers (MCP is the protocol AI assistants use to call tools).
Secronyx
Supplies controlled evidence from inside the host: disks, open files, services, processes and configuration. The agent asks; Secronyx decides what it may see and records every answer.
Any MCP server gives the agent more tools. This integration is different in five ways:
- Fixed read-only checks, never a shell. None can change a host or return file contents.
- One fleet proxy for the whole fleet. It adds 9 tools to the agent space, which allows 500, however many hosts you have.
- A label policy decides which hosts the agent may see. Restricted hosts are invisible to it.
- Every call is in the answering host's own audit log, with the agent, its run and the rule that allowed it.
- Results are signed by the host and verify offline, long after the incident.
Secronyx makes autonomous AI investigation of production governable.
How it fits together
The agent talks only to the Secronyx fleet proxy, which passes read-only checks to the hosts the agent may see. The hosts connect out to the proxy, so none of them opens a listening port.
How it's set up
- Install Secronyx on each host. Here that's three EC2 instances: web-1 and web-2, the web tier, and pci-db-1, a database labelled as holding card data.
- Run the Secronyx fleet proxy. It sits behind an HTTPS load balancer that admits only AWS DevOps Agent, the presenter and the proxy itself.
- Write one label rule. The agent may see hosts labelled
env=demo. Hosts labelleddata=pciare reserved for people in thesecopsgroup. - Register the fleet proxy in the agent space as a single MCP server.
- Point the Grafana alert at it. Each alert goes to AWS DevOps Agent and to the Secronyx Grafana bridge, which runs a fixed check of its own and keeps signed evidence.
The story: the disk is full, but nothing on it is big
At 08:34:45 Grafana fired: web-1's root filesystem was below 25% free. Yet /var/log held only 9 MB, and every directory looked small. A metric can't explain that.
We set it up on purpose. A stand-in service, orders-api, kept writing to a log file that log rotation had already deleted. The space was still used, but the file no longer had a name.
In the screenshots, teal boxes mark the agent using Secronyx. Amber marks what policy blocked or what failed.
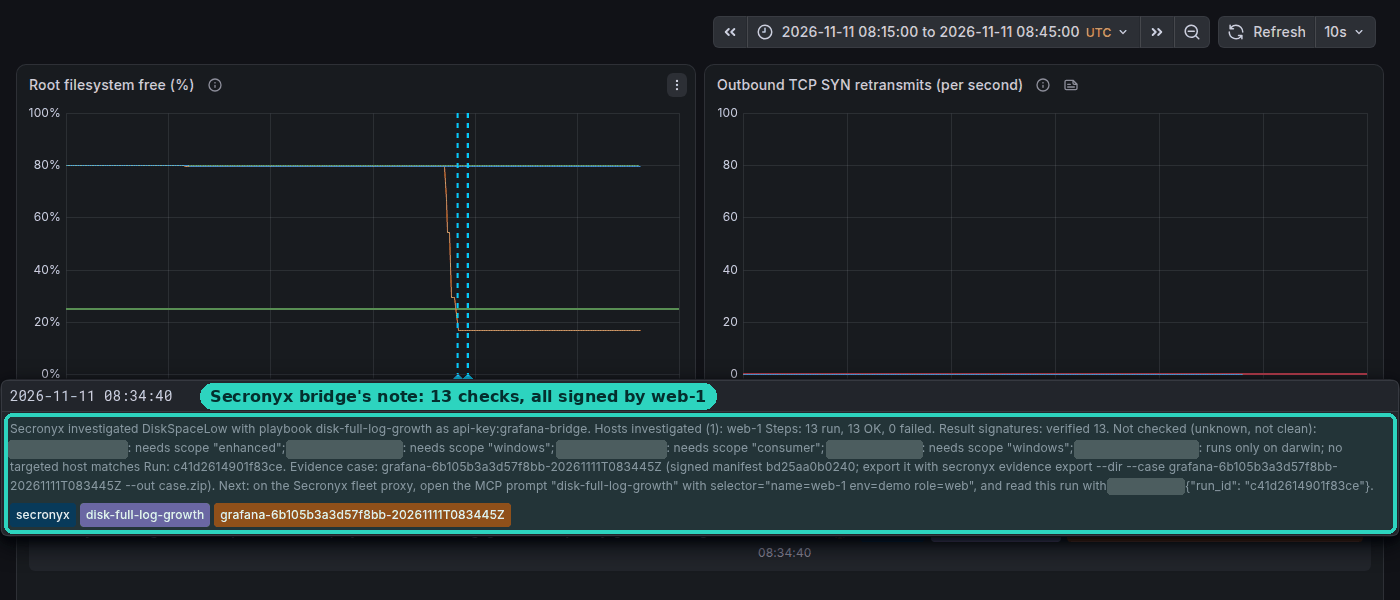
Grafana shows only the drop. The teal box is the Secronyx bridge's note on the panel: the checks it ran, all 13 signed by web-1.
AWS DevOps Agent opened an investigation in the same second. Nobody steered it. From 08:35:07 to 08:37:42, under three minutes, it made 41 calls to Secronyx. Eight of them compared web-1 with its healthy twin, web-2.
At 08:38:54, 4 min 9 s after the alert, it reported the root cause. orders-api was holding open a deleted 4.9 GiB log file. That one file explained about 98% of the extra space web-1 used compared with web-2. The agent also:
- found the rotation rule that caused it, and noticed that web-2 has the same bug on a smaller scale;
- found a configuration change that exists only on web-1. It called this the likely trigger but unconfirmed, because Secronyx doesn't return file contents.
At 08:41:00 it proposed a fix for a person to apply. It applied nothing, because Secronyx can't change a host.
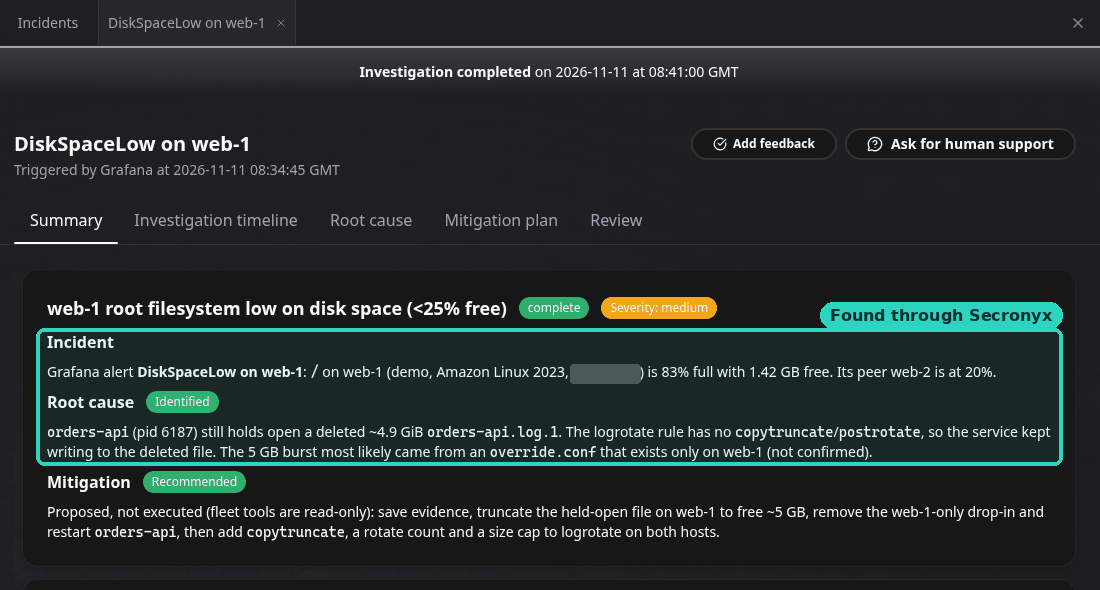
The top of the agent's summary. The teal box is what it found through Secronyx: 83% used, and 4.9 GiB held by a deleted file.
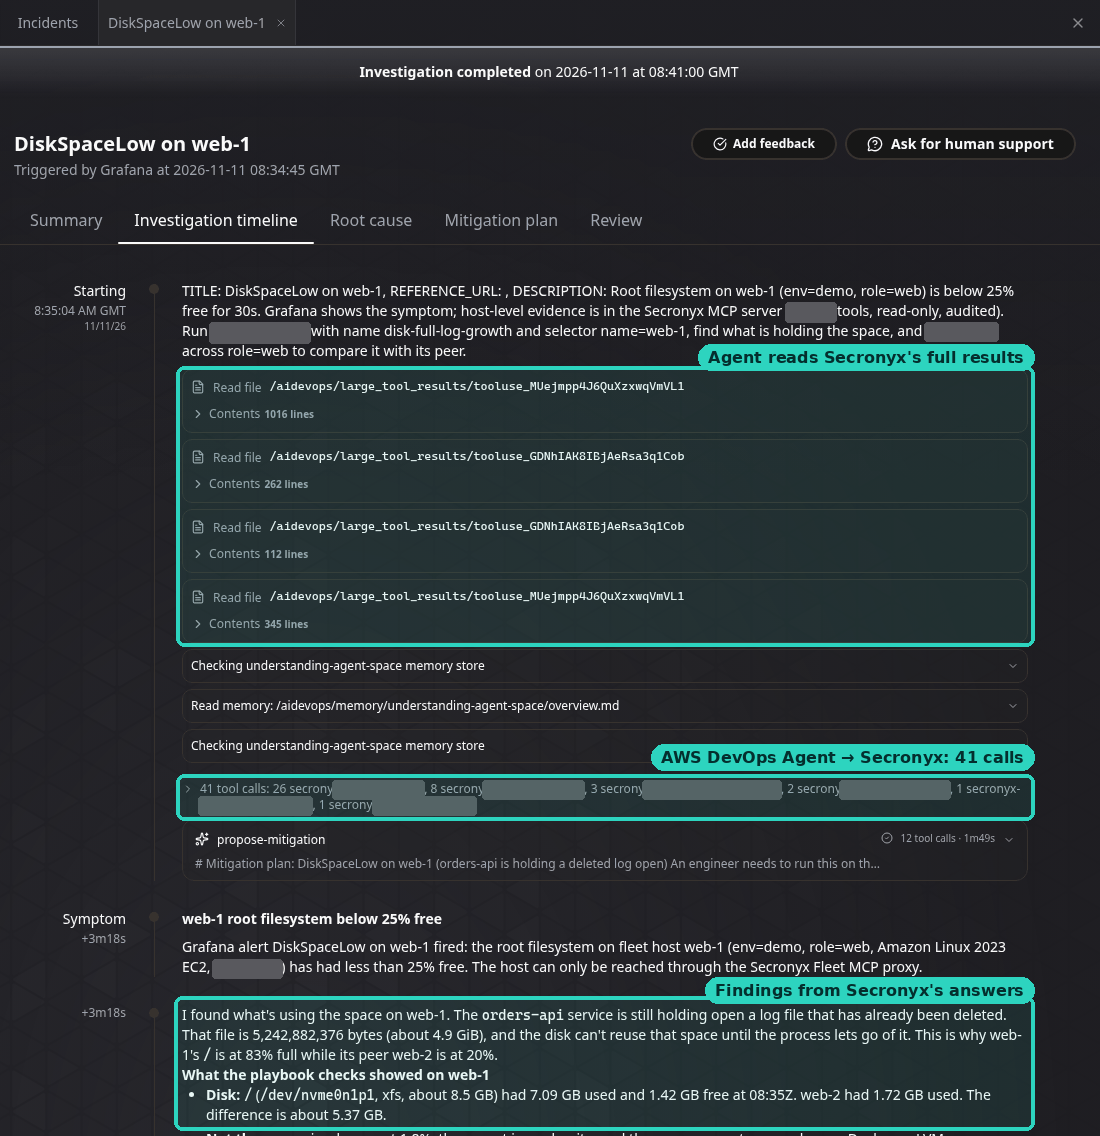
The investigation timeline. Teal boxes: the agent's 41 calls to Secronyx, the results it read back and the findings it drew from them. Tool names are blanked.
What Secronyx proves
What the AI actually saw
Before a host runs anything, it checks a single-use pass signed by the fleet proxy, naming the caller and the rule that allowed the call. The host then writes the call to its own audit log. So you can read, on the host itself, every check the agent ran there.
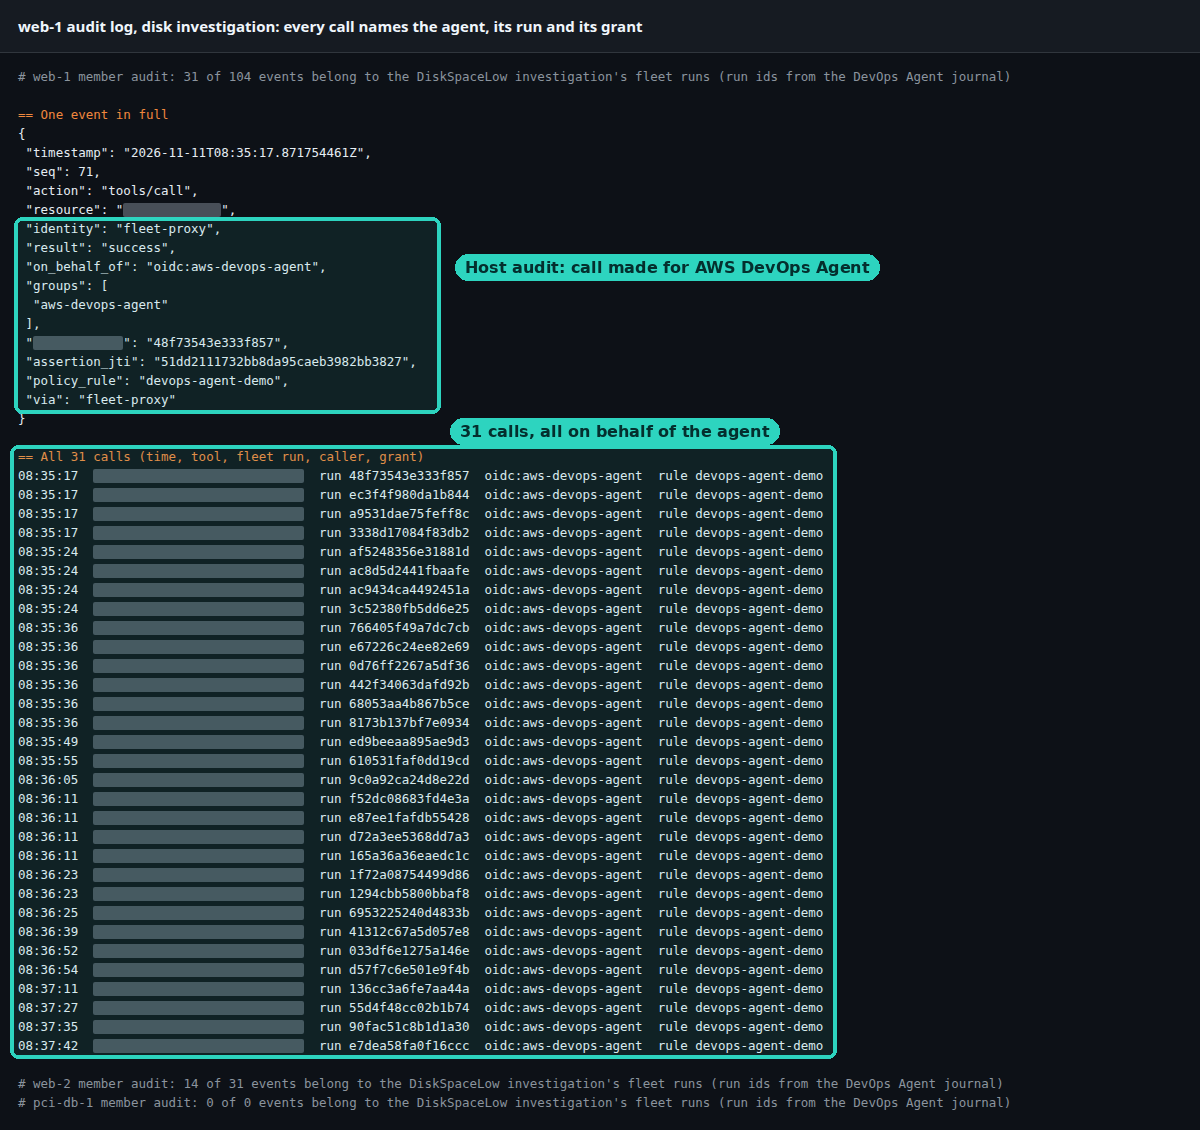
web-1's audit log for this investigation. Teal: one call in full, made on behalf of the agent, then all 31 calls that ran on web-1, each under the devops-agent-demo rule. Tool names are blanked.
What it wasn't allowed to see
To the agent, pci-db-1 doesn't exist: it's missing from its host list. When a follow-up message asked the agent to check it, it got zero hosts back. It reported pci-db-1 as "unchecked, not clean" and didn't try to get round the rule. The proxy recorded the attempt. pci-db-1 recorded nothing, because nothing reached it.
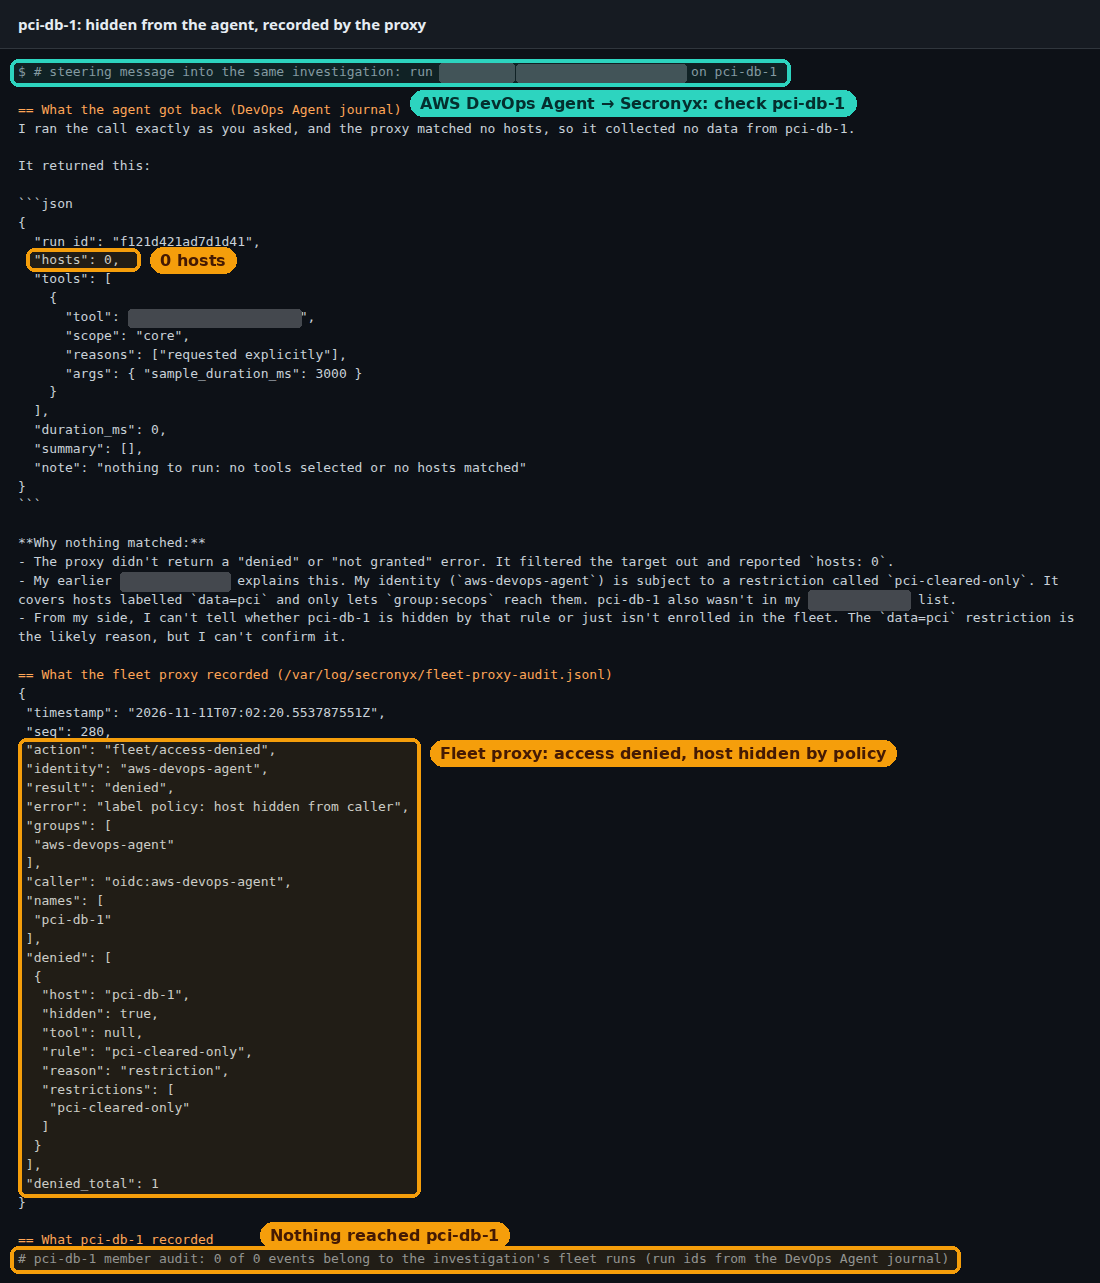
Teal: the agent's request. Amber: zero hosts matched, the proxy's access-denied event naming the pci-cleared-only rule, and pci-db-1's empty audit log.
Evidence you can check later
Each investigation is saved as an evidence case that anyone can check offline with secronyx evidence verify. It checks the proxy's signature, the fingerprint (hash) of every result and each host's signature on its own results. Change one bit and it fails, naming the result. The disk case verified: 28 findings, none failed.
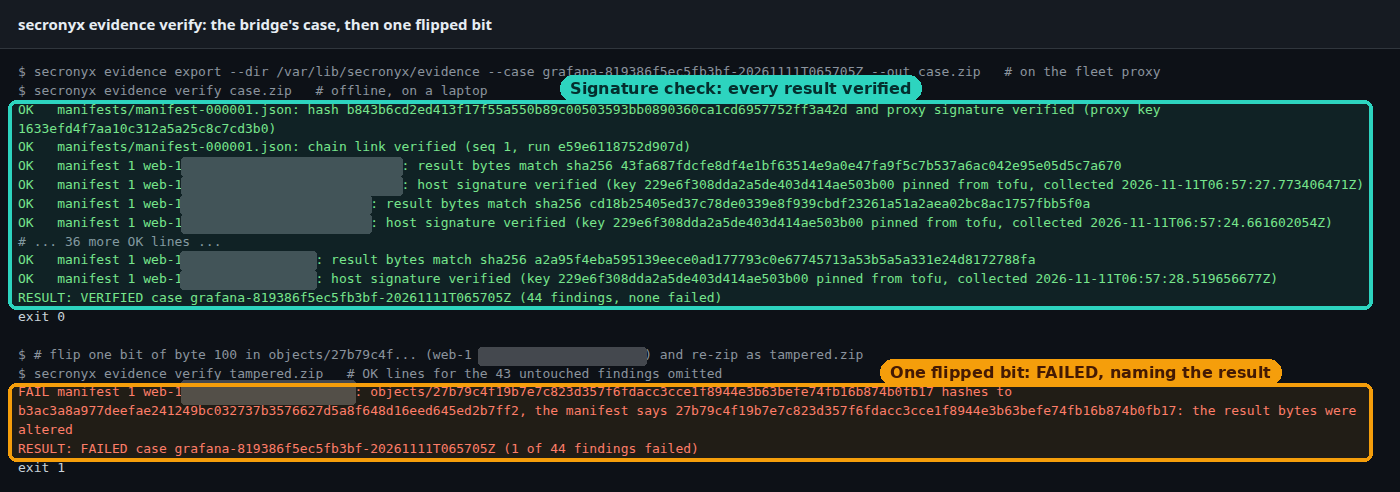
Tamper test shown on the high-CPU case from the same session. Teal: that case verifies, 44 findings, none failed. Amber: flip one bit in one stored result and it fails.
Why not just use your APM?
Application performance monitoring (APM) tools such as Datadog, Dynatrace, New Relic and Splunk AppDynamics are good at what they were built for: tracing requests through your code and charting metrics over time. In this demo, a metric was enough to say that web-1's disk was filling up. It couldn't say why. The answer was a deleted file still held open by a process, which only the host itself can show.
| APM platform | Secronyx | |
|---|---|---|
| What it sees | Request traces, code-level latency, metrics and the logs you ship to it | The state of the host: open files, processes, services, scheduled jobs, start-up items, packages, configuration, sockets and logs, on Linux, macOS and Windows |
| How it collects | Always on: agents stream telemetry to the vendor, and you pay to ingest and keep it | On demand: a check runs only when someone, or an AI, asks. Nothing leaves the host unless it is asked for |
| Set-up | Language agents in each application, plus a host agent | One binary per host. No code changes, so it also covers legacy servers and software you can't instrument |
| Giving it to an AI | The AI sees whatever the platform holds, under user roles | Each check is read-only, a label policy decides which hosts the AI can reach, and restricted hosts are invisible to it |
| Evidence | Dashboards and stored data | Every answer is signed by the host and recorded in that host's audit log, and the evidence verifies offline |
Cost. APM is priced on what it collects: per host, per CPU core, per GiB of memory or per GB ingested. Secronyx is priced per endpoint and collects nothing in the background. For an illustrative fleet of 100 hosts, each with 4 vCPUs and 16 GiB of memory, at published list prices in November 2026:
| Product | List price | 100 hosts, per month |
|---|---|---|
| Secronyx Pro | £5 per endpoint per month | £500 |
| Datadog Infrastructure Pro + APM | $15 + $31 per host per month (annual) | $4,600, before logs |
| Dynatrace Full-Stack | $0.01 per GiB of memory per hour | about $11,700 |
| Splunk AppDynamics Premium | $33 per vCPU per month (annual) | $13,200 |
| New Relic | $0.40 per GB ingested after 100 GB, plus $99 to $349 per full user | depends on data volume and users |
List prices from the vendors' published pricing as at November 2026, before discounts, logs and add-ons. Check current prices before comparing. Secronyx Pro includes 200 queries per endpoint per month.
Use both. APM tells you which service is slow and when it started. Secronyx tells you what is wrong inside the host, and lets an AI find that out safely, with proof. Keep your APM for traces and trends, and point your AI investigator at Secronyx for the rest.
The full run log
The full run log has all three investigations from the session: the full disk, a quiet compromise on web-2 and a CPU spike. It has the timelines, every screenshot, what the agent got wrong and the caveats.
Try it on your fleet
Secronyx is in beta. Tell us about your fleet and we'll help you connect it to AWS DevOps Agent.
Read more: fleet deployment · the full run log
Built 2026-11-11. Found a mistake? Tell us.