Demos
Demo run log: Grafana alert to AI investigation
The full record of the Grafana demo: the timeline, every screenshot, what the AI did turn by turn, what was refused and the caveats.
This is the full run log. For the short version, start with Demo: Grafana alert to AI investigation.
Grafana tells you when something broke. Secronyx tells you why, from inside the hosts, with evidence each host has signed. This demo joins the two. A Grafana alert goes to Secronyx. Secronyx investigates the alerting host, keeps a signed evidence case and writes its findings back onto the Grafana panel. An AI assistant then picks up that evidence and posts its own verdict on the same panel.
Everything on this page comes from one run on 11 November 2026. All times are UTC.
What was running
The demo runs on a laptop with Docker Compose:
- Three hosts: web-1 and web-2 (labelled
env=demo,team=web) and db-1 (labelledenv=prod,team=data). Each runs Secronyx and dials out to the fleet proxy. None of them opens a listening port. - Prometheus and cAdvisor, recording CPU per host with the same
envandteamlabels. - Grafana, with a CPU dashboard and a
HighCPUalert: more than 0.5 CPU cores busy for 20 seconds. - The Secronyx fleet proxy with the Grafana alert bridge switched on. Grafana's alert webhook posts to it.
- Claude Code, connected to two MCP servers: Grafana's own MCP server and the Secronyx fleet proxy.
The labels match on both sides. The Prometheus series for web-1 carries env=demo and team=web, and so does the Secronyx host called web-1. That alignment is the whole integration: the bridge turns the alert's labels into a selection of hosts.
Every credential was generated for the run and thrown away afterwards.
Timeline
| Time | What happened |
|---|---|
| 06:35:27 | web-1, web-2 and db-1 connect to the fleet proxy. |
| about 06:36:30 | A synthetic load starts burning one CPU core on web-1. |
| 06:36:50 | web-1 is above the threshold and the HighCPU alert goes to Pending. |
| 06:37:10 | The alert fires for web-1 only, and Grafana sends it to Secronyx. |
| 06:37:15 | The bridge accepts the alert and picks the performance-triage playbook. |
| 06:37:18 | It runs the playbook's 21 read-only checks on web-1. All 21 succeed and all 21 results are signed by web-1. It stores them as a signed evidence case. |
| 06:37:21 | It writes an annotation onto the CPU panel at the moment the alert started. |
| 06:37:56 to 06:38:17 | Claude Code reads the annotation, queries Prometheus, reads the bridge's results and runs two more read-only checks on web-1. It posts its verdict as a second annotation. The whole AI step took 68 seconds. |
| 06:40:15 | A second load fires the alert for db-1, a production host. The bridge is not allowed to look at it, so it investigates nothing and says so on the panel. |
| 06:40:45 to 06:40:55 | Both alerts resolve. The bridge marks its web-1 annotation as resolved, so it becomes a shaded region on the panel. |
The alert fires
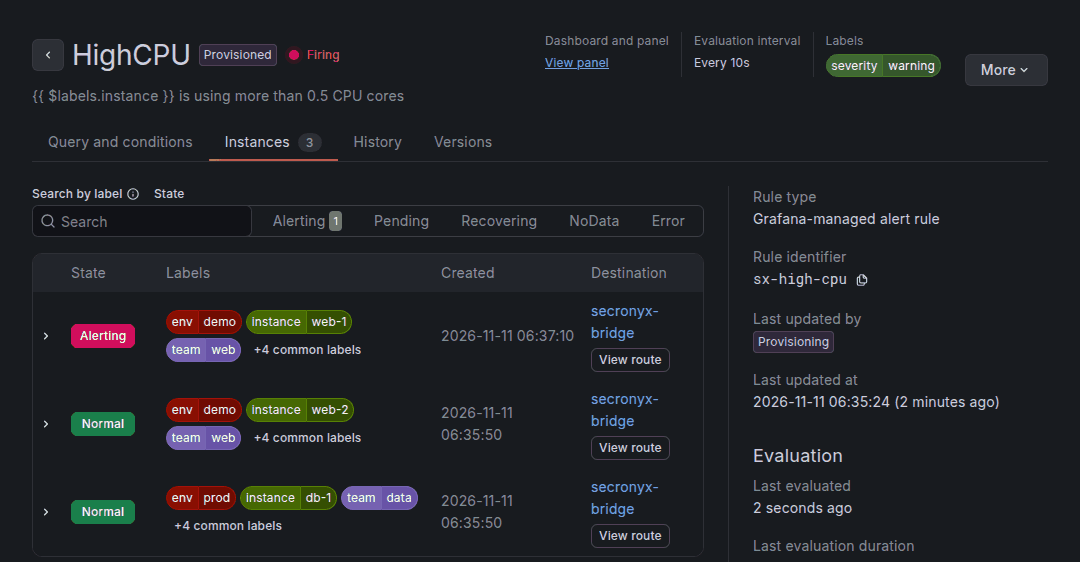
The alert is firing for web-1 only, with the labels env=demo and team=web. Its destination is the Secronyx bridge.
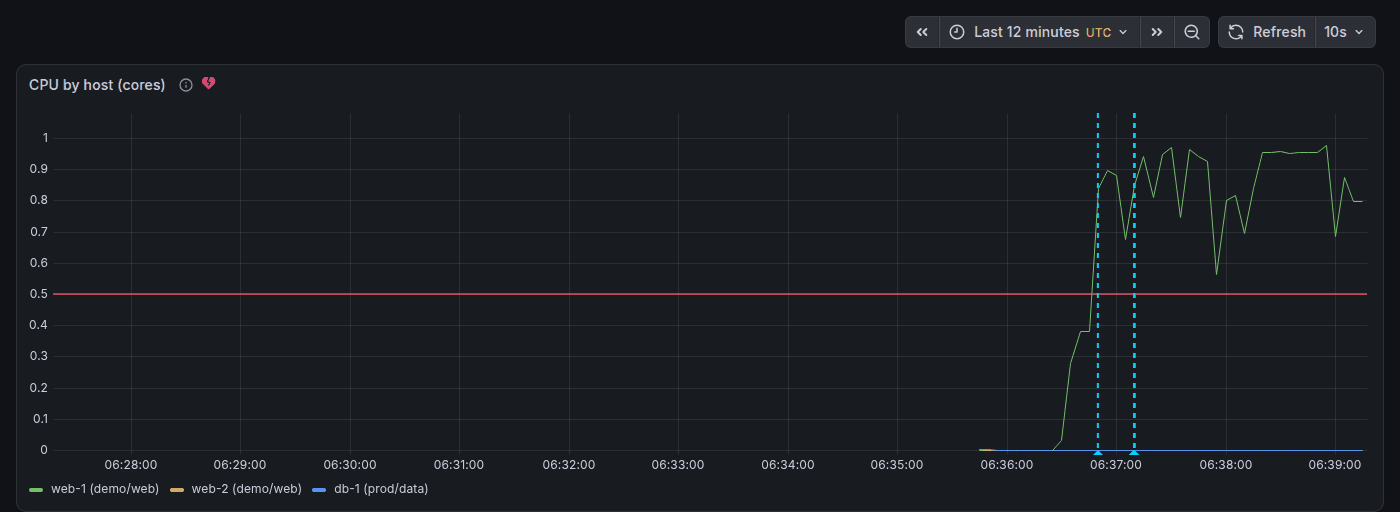
web-1 crosses the 0.5-core threshold. The markers show the alert going to Pending at 06:36:50, then firing at 06:37:10. The bridge's annotation and the AI's annotation sit at the same moment.
The bridge investigates
The bridge does not use a model. It follows fixed rules: an alert called HighCPU runs the performance-triage playbook on the hosts the alert names. It runs that playbook as its own identity, through the same label policy as any person. The policy grants the bridge the env=demo hosts and nothing else.
Then it writes an annotation that says:
- which playbook ran, on which hosts, as which identity;
- how many checks ran and how many results had valid host signatures (21 of 21);
- what it could not check, listed rather than hidden (one check runs only on Windows);
- the evidence case it saved, and how to export it;
- the next step, for a person or for an AI.
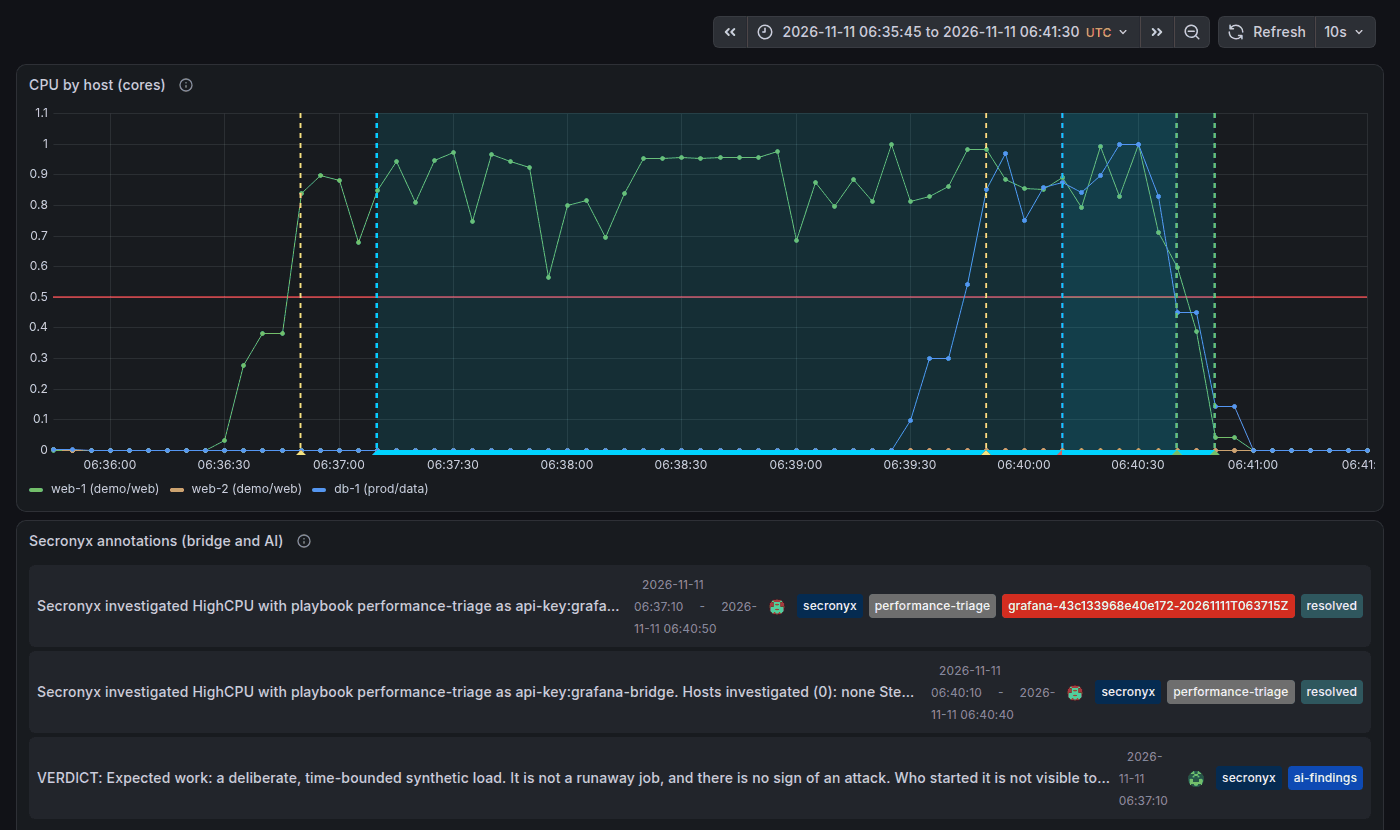
The whole incident in Grafana. The bridge's web-1 annotation became a region that ends when the alert resolved. The db-1 alert got an annotation that investigated nothing. The list below the graph shows the bridge's two entries and the AI's verdict, tagged ai-findings.
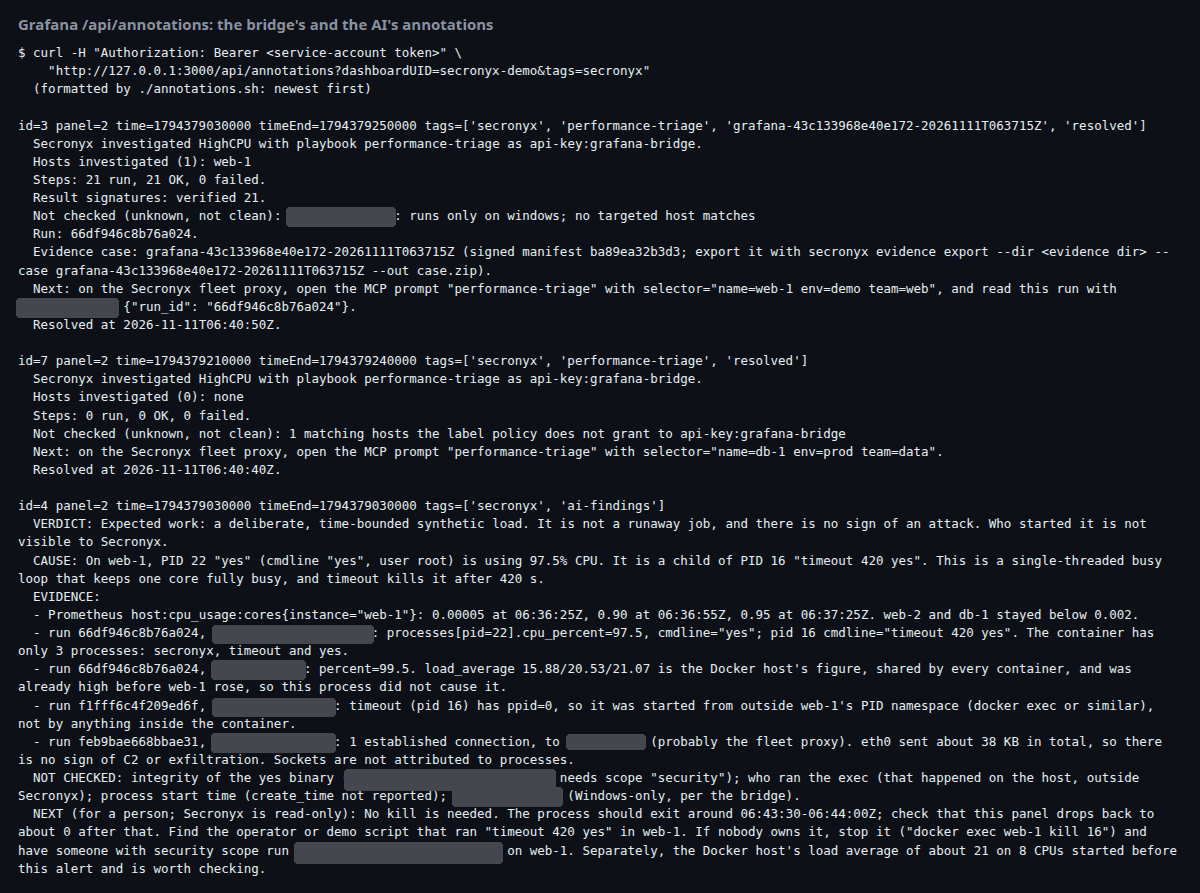
The full annotation text, read back from Grafana's API. The first entry is the bridge's web-1 investigation: 21 checks, 21 verified signatures, the run, the evidence case and the next step. The second is the db-1 alert: Hosts investigated (0), because the label policy does not grant db-1 to the bridge. The third is the AI's verdict, which cites a run and a field for every claim.
The AI picks it up
Claude Code ran headless with both MCP servers and nothing else. It had no shell and could not read files. Through Grafana's MCP server it could read dashboards, query Prometheus and create annotations. Through the fleet proxy it could only make read-only calls, on the hosts its key's group is granted.
It started from the bridge's evidence, not from a blank page. In nine turns it:
- read the bridge's annotation;
- queried Prometheus for when web-1's CPU rose;
- read the bridge's signed results for web-1, including the sampled process list and CPU details;
- asked the fleet proxy which checks fit a further question, and was told that some of them need a scope it does not have;
- ran two more read-only checks on web-1: the process tree and its network connections;
- posted its verdict as an annotation on the same panel.
Its verdict: the load was expected work. A single process, yes, was using 97.5% of a CPU core. It was the child of timeout 420 yes, so it would stop by itself after seven minutes. It had been started from outside the container, and web-1 showed no unusual network activity. The AI also said what it could not check: whether the yes binary was genuine (that check needs a security scope it was not given), and who started the command.
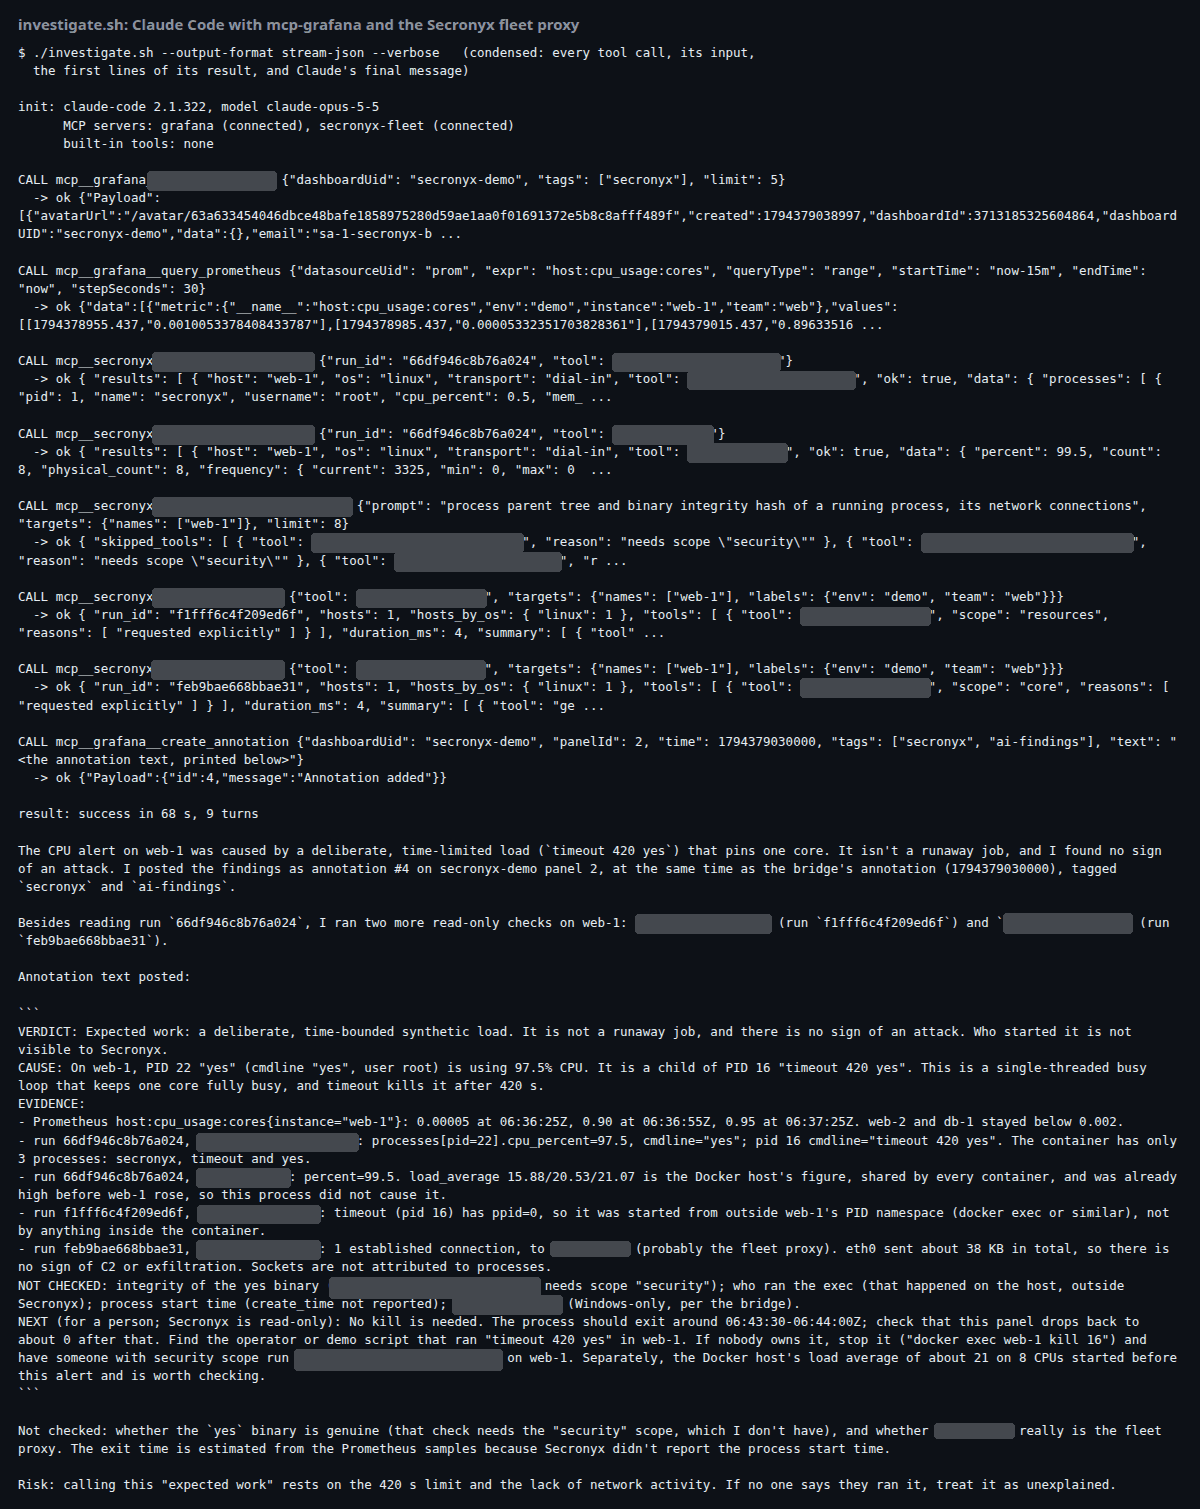
A condensed transcript of the AI step. Both MCP servers are connected and the built-in tools are none. Each call is listed with the start of its result. The run ends with the verdict posted as annotation 4.
The audit trail
The fleet proxy writes a hash-chained audit log. It records each alert, each decision the bridge took, each fan-out to the hosts, the evidence it wrote, every annotation, and every call the AI made under its own key.
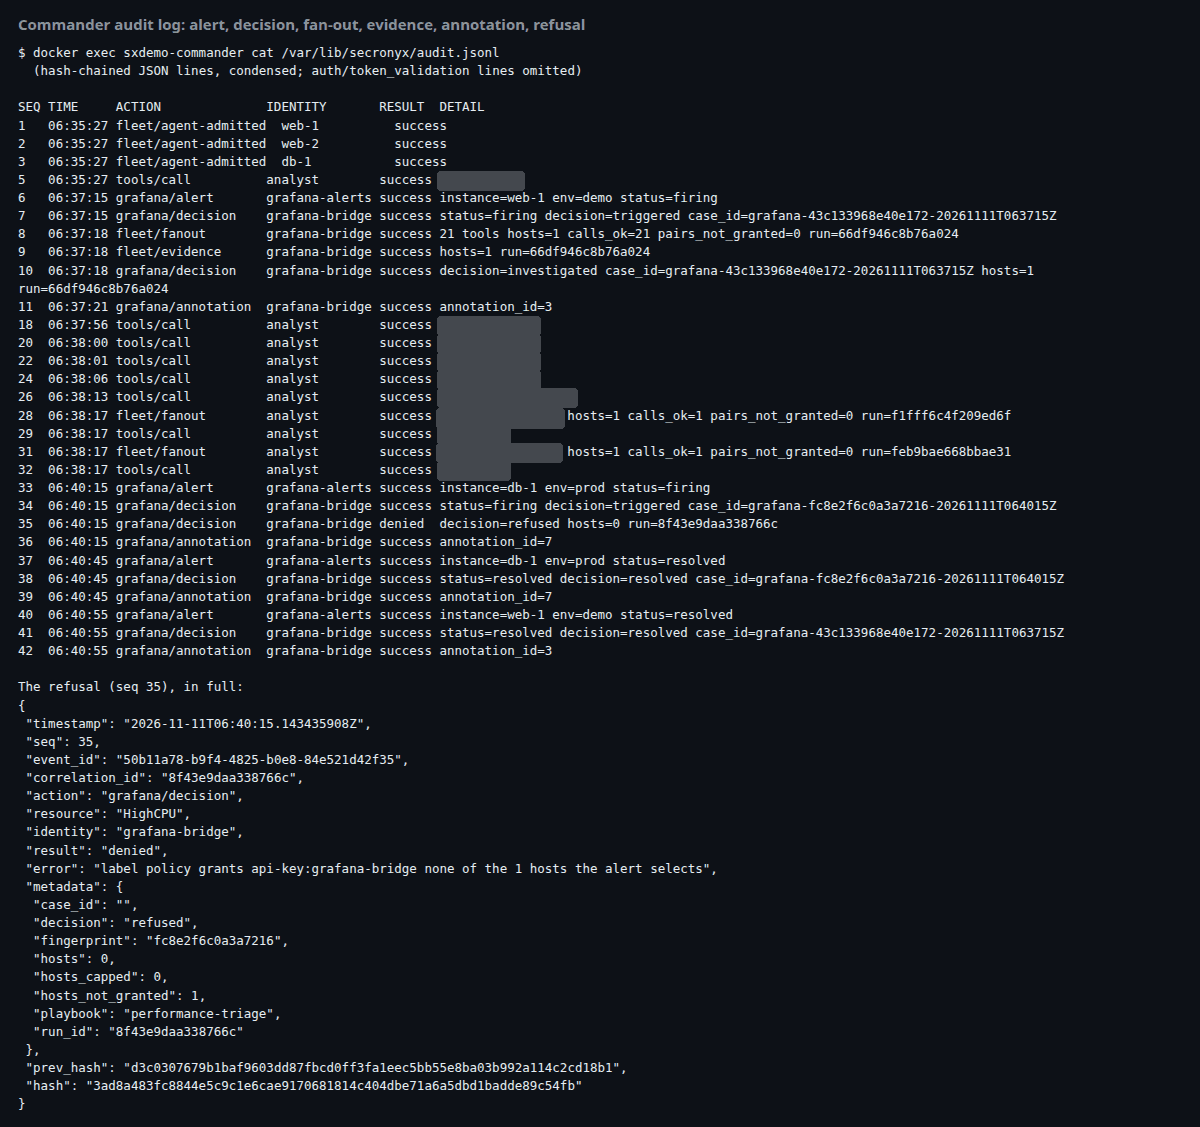
The audit log for the run. Sequence 35 is the refusal for db-1, shown in full below the table: the label policy grants the bridge none of the hosts the alert selects.
Verifying the evidence
The bridge's evidence case can be exported as a zip and checked offline, on any machine, with the secronyx evidence verify command. It checks the proxy's signature on the case manifest, the hash of every stored result, and the signature each host put on its own results.
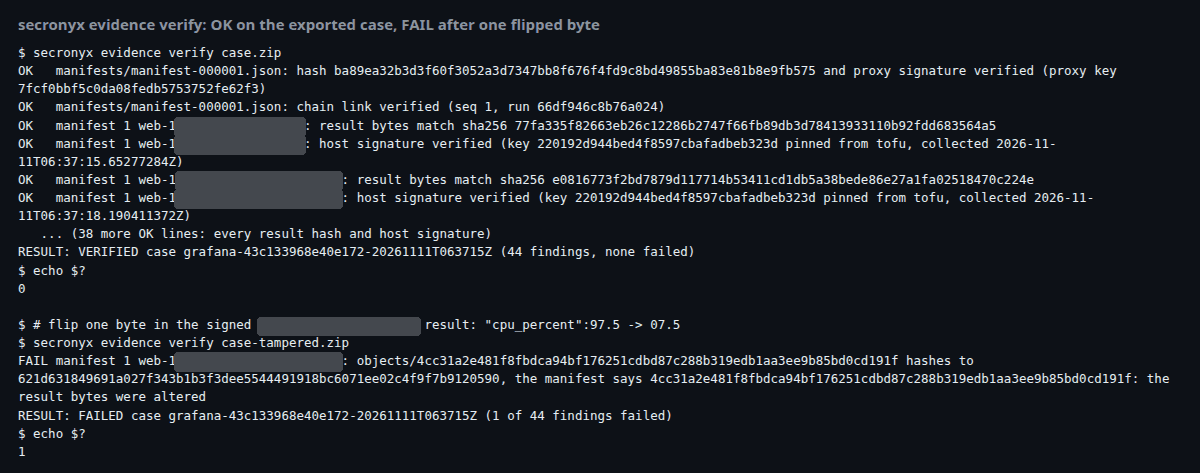
The exported case verifies: 44 findings, none failed, exit code 0. Changing one byte in a signed result (97.5 becomes 07.5) makes it fail with exit code 1, and it names the result that was altered.
What was restricted, and why
- Grafana can only post alerts. Grafana's key for the webhook carries one permission: deliver alerts to the bridge. It cannot run a single check itself. An alert is not a way around access control.
- The bridge sees only what the label policy grants it. It runs as its own identity, through the same label policy as a person. It was granted the
env=demohosts, so the db-1 alert (env=prod) investigated nothing, and the refusal is on the panel and in the audit log. - The AI is read-only and scoped. Its key belongs to the
sregroup, which may read the bridge's runs and make read-only calls onenv=demohosts. Checks that need the security scope were refused to it, and it reported them as not checked rather than clean. - No shell, no file access. The AI client ran with its built-in tools switched off. Everything it knew came through the two MCP servers.
Caveats
- The load was synthetic: a
yesprocess undertimeout. The point is the path from alert to evidence, not the incident. - The hosts were containers on one laptop. The AI noticed that the host's load average is shared by every container and said so.
- Headless Chrome cannot hover, so there is no screenshot of Grafana's annotation tooltip. The annotation list and the API output show the same text.
- Tool names are blanked out in the screenshots on purpose.
- Versions used: Grafana 13.2.4, Grafana's MCP server 2.1.1, Prometheus 3.15.1, cAdvisor 0.52.1 and Claude Code 2.1.322.
Where to go next
- Demo: AWS DevOps Agent investigates with Secronyx, the same idea with Amazon's agent and a real AWS fleet.
- Fleet deployment, for the fleet proxy and its hosts.
- Audit logging, for the hash-chained log.
- Tutorial: verify the audit chain.
Built 2026-11-11. Found a mistake? Tell us.