Demo · Zabbix
Turn a Zabbix problem into a host-level investigation, without giving AI shell access
A Zabbix trigger fires on a crash-looping service, a webhook sends the problem to Secronyx, which gathers signed evidence from inside the host in under a second, and Claude finds the cause. Nothing on the host can be changed, and every check is on record.
Zabbix saw a service on web-2 restarting over and over. Through Secronyx, Claude found why: a config change seconds earlier had moved it onto a port another program already held. It named the file, the time, the error and the healthy twin to copy from, and it said what it could not see. There was no shell access and no change to either host.
Request accessSee the investigation
This is a recorded run in AWS, not a mock-up. A Zabbix trigger fired, a Zabbix webhook sent the problem to Secronyx, and Claude, Anthropic's AI assistant, picked up from there. We recorded it on 12 November 2026 in AWS's London region. All times are UTC.
The problem
- A monitoring problem says that something is wrong, not why. Zabbix saw the restart counter climb. It can't say what changed, what the service logged as it died, or how web-2 now differs from web-1.
- Giving an AI a shell is too risky. A shell can change anything and read anything. You don't hand that to an AI on a production server.
- There's no trail of what the AI looked at. When an AI reaches a verdict, you need to know what it saw, on which host, and who allowed it.
The investigation: a crash loop on web-2
Both web servers run a small service, orders-api, on 127.0.0.1:8081, with systemd set to restart it whenever it stops. The Zabbix agent on each server reports systemd's restart count every 30 seconds. A trigger raises a High problem when the count rises by three or more in five minutes.
We broke web-2 the way a bad deploy would. One line in /etc/orders-api/orders-api.env set the port to 9100, which node_exporter already holds, and the service was restarted. From then on it could never start.
In the screenshots, tool names are blanked.
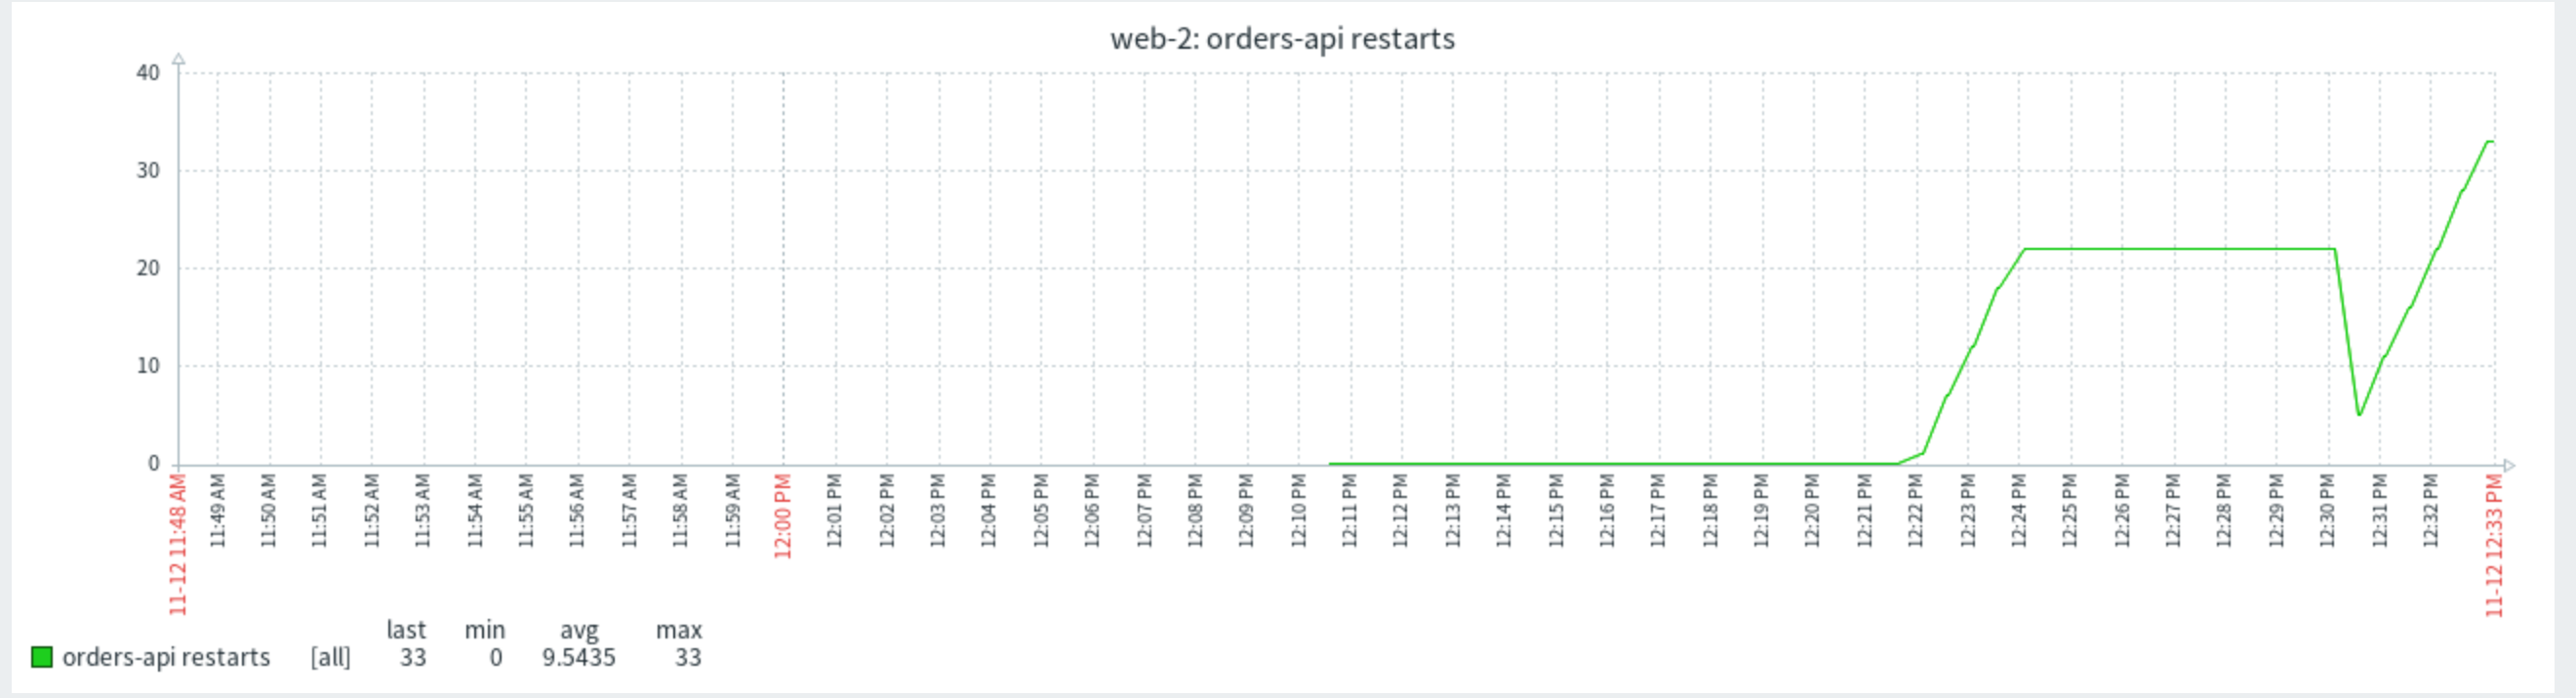
systemd's restart count on web-2, as Zabbix collected it. The first climb, at 12:22, is our first attempt (see below). The drop at 12:30 is our change restarting the service, which resets the count; then it climbs every few seconds.

We changed the file at 12:30:09. Zabbix raised the problem at 12:31:07. The resolved row below it is our first attempt.
The first attempt didn't reach Secronyx. We had left the webhook's media type disabled in Zabbix, and Zabbix logged "Media type disabled" against the problem. We enabled it, put web-2 back, waited for Zabbix to see it recover, and broke it again for the recording. The setup script now enables the media type.
At 12:31:12 the problem reached the Secronyx alert bridge on the fleet proxy. The bridge matched the trigger's name to the service-failure-triage playbook and ran its 13 read-only checks on web-2. Half a second later every result was signed by web-2 and saved as an evidence case.
At 12:31:48 we started Claude with one tool: the Secronyx fleet proxy. The Zabbix problem, the trigger and the item's recent values went into its first prompt. No shell, no file access and no Zabbix access beyond that. Nobody steered it after the first prompt. It read the bridge's results, went further where the evidence pointed, compared web-2 with web-1, and wrote its report at 12:34:13. It made 26 calls, all to Secronyx.
Its verdict was misconfiguration, and it named:
- the file,
/etc/orders-api/orders-api.env, changed at 12:30:09.287; - the healthy listener on
127.0.0.1:8081stopping 17 milliseconds later; - the error on every start since:
OSError: [Errno 98] Address already in use, binding127.0.0.1:$PORT; - that web-1 still runs the service on 8081, and web-2 has nothing there;
- the four ports web-2 listens on, one of which the new setting must collide with, including node_exporter's 9100;
- that the change arrived over an AWS Systems Manager session, with no interactive login, and no deploy or package change since 12:05.
It also read the Zabbix numbers correctly: the count sat at 22 from our first attempt, reset to 0 when the service restarted at 12:30:09, and then rose about once every 5 seconds, so the alert was real. Its fix was to restore PORT=8081 to match web-1 and confirm the counter stops.
It kept two leads open, and both are real. The earlier Systems Manager command it had investigated was our Falco demo on web-1 a quarter of an hour before, so it asked a person to confirm this change was sanctioned. The two files deleted from web-2 at 10:44 were our Alertmanager demo's clean-up.
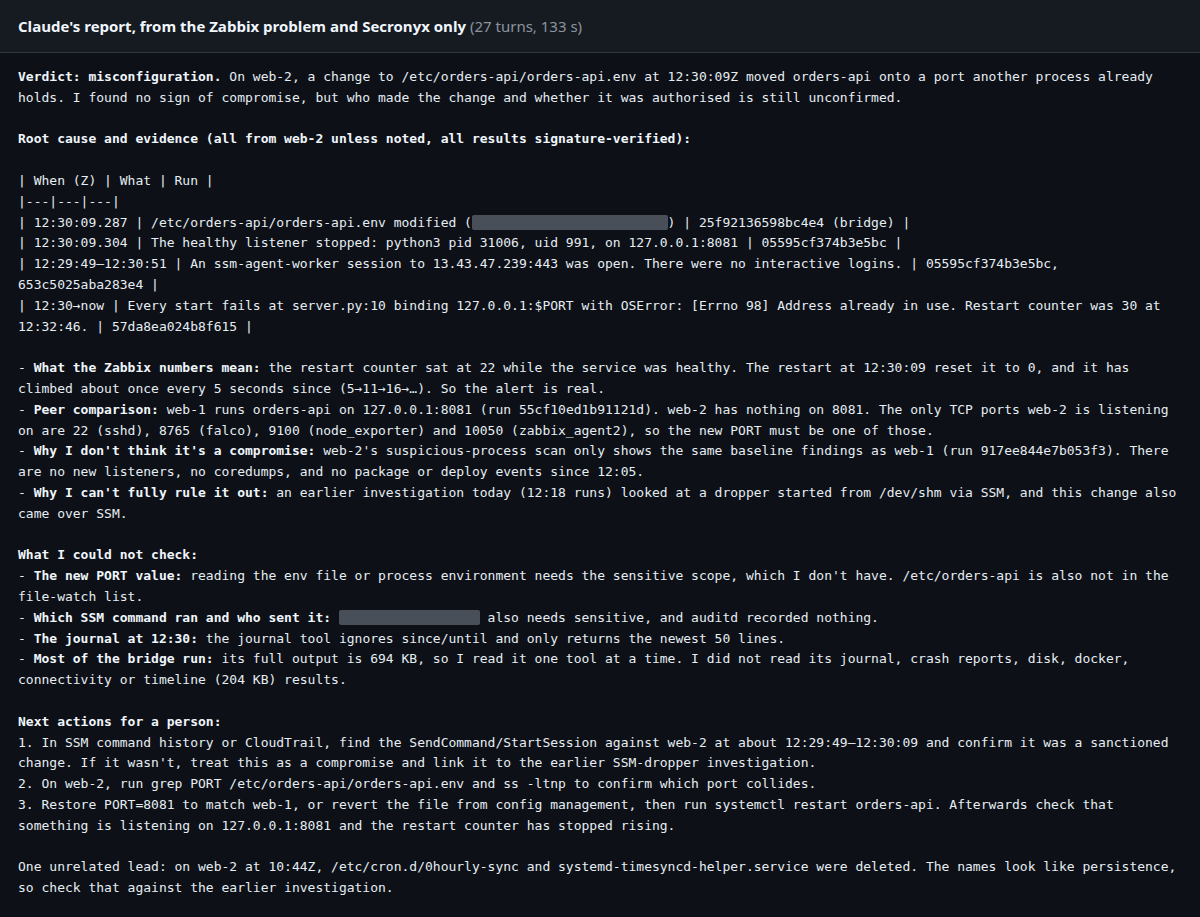
Claude's report, unedited apart from the blanked tool names.
It was also clear about its limits:
- It could not read the new port number. That means reading the env file or the process's environment, which needs a scope this policy doesn't give the AI.
- It could not see which Systems Manager command made the change, for the same reason.
- The journal check returned only its newest 50 lines, so it worked from the service's own error instead.
- The bridge's full output was 694 KB, so it read the results one check at a time and said which it skipped.
It changed nothing, because Secronyx can't change a host. The fix was for a person to make.
What Secronyx proves
What the AI actually saw
Before a host runs anything, it checks a single-use pass signed by the fleet proxy, naming the caller and the rule that allowed the call. The host then writes the call to its own tamper-evident audit log. web-2's log shows the bridge's 13 checks, then Claude's 8 follow-ups, each under its own rule.
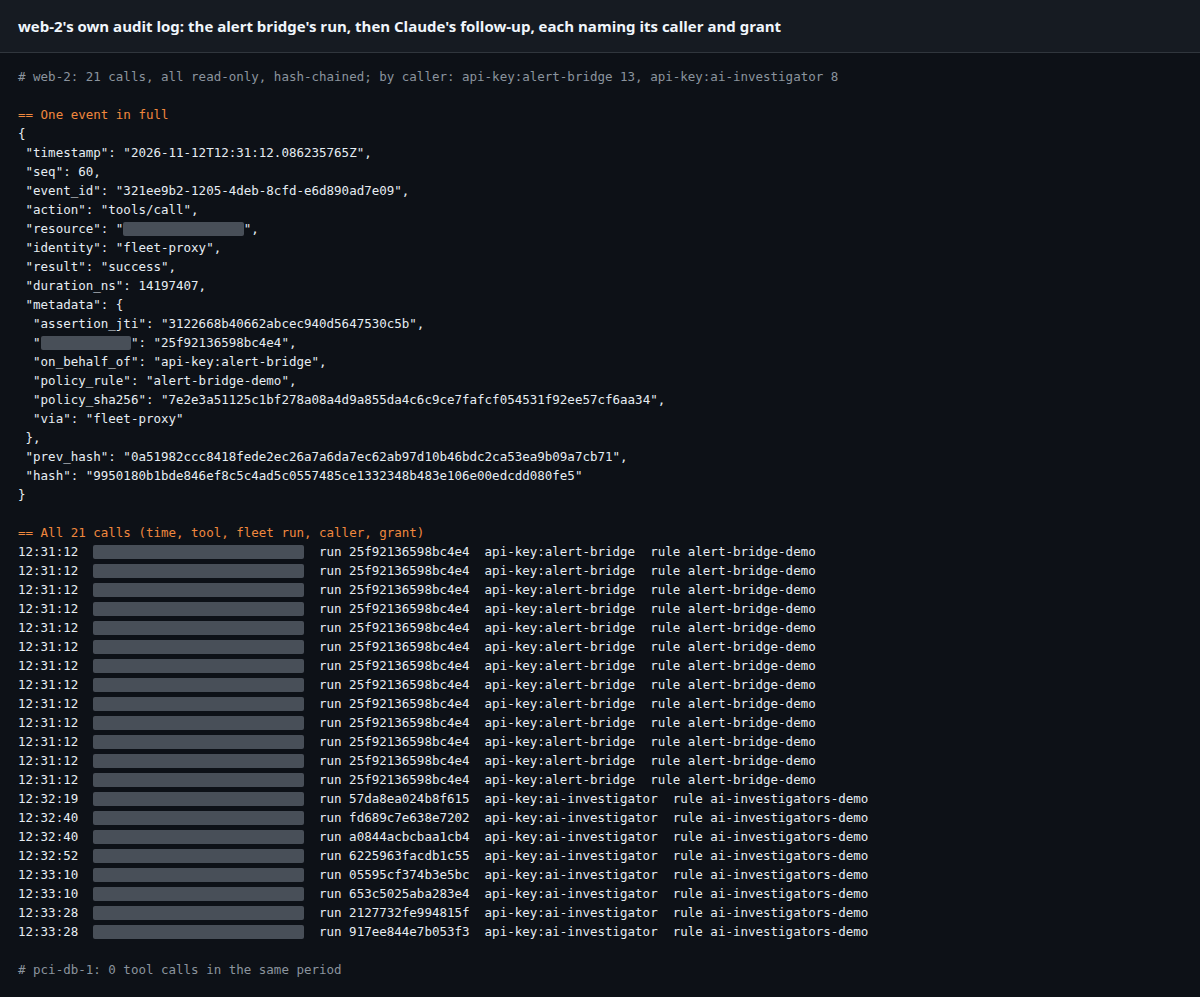
web-2's audit log. Each call names who it was for (the alert bridge or the AI investigator), the run and the rule that allowed it.
What it wasn't allowed to see
pci-db-1, a database host labelled as holding card data, is reserved for the security team. On the fleet it is outside Claude's access, and Claude stayed on the two hosts its access covers. pci-db-1's own audit log has no calls from this investigation, because nothing reached it.
Evidence you can check later
The bridge's evidence case can be checked offline by anyone with secronyx evidence verify. It checks the proxy's signature, the fingerprint (hash) of every result and web-2's signature on its own results. All 28 findings verified. Then we changed one stored result, renaming orders-api to orders-apl, and verification failed, naming the result.
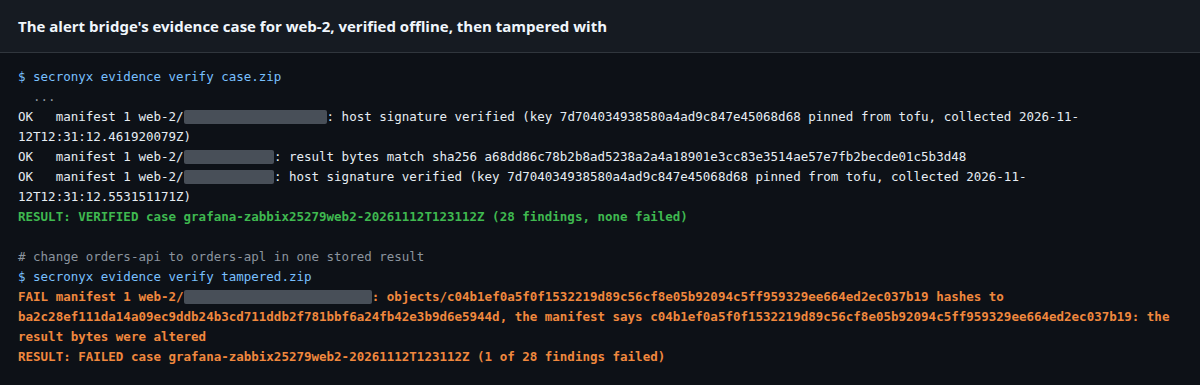
Green: the case verifies. Amber: change one letter in one stored result and it fails.
Why Secronyx alongside Zabbix
Zabbix
Collects the metrics and states you configure from every host, keeps their history, and raises problems when triggers match, with escalations and notifications.
Secronyx
Answers from inside the host, when the problem fires: config changes, service failures, error output, listeners and the twin host's state. It decides what each caller may see and records every answer.
Zabbix monitors and Claude does the reasoning. Secronyx provides the controlled, read-only access to host-level evidence, with independently verifiable records of every investigation.
- Evidence within a second of the problem. The bridge runs a fixed playbook as soon as Zabbix notifies it, before anyone opens a laptop, so the evidence reflects the moment it fired.
- Questions nobody configured an item for. Zabbix tracked the restart count. Secronyx could also say which file changed, what the service logged as it died and what the twin host looks like now.
- No model inside the product. The bridge is deterministic. Any AI that speaks MCP can pick up from its results, and so can a person.
- One webhook media type. Zabbix needs no module: a standard webhook media type with its own key, kept in a secret macro, which can post problems and nothing else.
- A label policy decides what each caller may see, the bridge and the AI alike, and restricted hosts stay invisible.
- Every check is in the answering host's own audit log, and the results are signed so they can be checked long after the incident.
Why not just run a script from the alert?
Zabbix can call any webhook, so a team could point it at a script that logs in to the host and runs commands. That works, but it moves the risk rather than removing it.
| Webhook to your own script over SSH | Zabbix + Secronyx | |
|---|---|---|
| Can it write | Whatever the script's account can, and the AI can if it drives the script | No. There is no write path |
| Credentials | An SSH key or sudo rule on every host | Each host dials out to the proxy with its own key; the Zabbix key can only post problems |
| Knows what to check | What someone wrote into the script, per OS | Playbooks and 630 named, typed checks (661 with sensitive checks enabled), the same on Linux, macOS and Windows |
| Secrets | Whatever the commands print | Removed before results leave the host |
| Authorisation | One account, one level of access | Per check, per caller and per host label |
| Audit | Shell history the same account can edit | Each host's own hash-chained log, naming the caller and the rule |
| Evidence | Text output, if someone saves it | Signed results that verify offline |
How it fits together
The bridge and Claude talk only to the Secronyx fleet proxy, which passes read-only checks to the hosts each of them may see. The hosts connect out to the proxy, so none of them opens a listening port.
How it's set up
Install Secronyx on each host. Here that's three EC2 instances: web-1 and web-2, the web tier, and pci-db-1, a database labelled as holding card data. Zabbix 7.0 LTS runs on its own instance, and Zabbix agent 2 on the web servers registers itself and reports in active mode.
Run the Secronyx fleet proxy with the alert bridge. One config file maps each trigger name to a playbook. The problem's host name picks the host.
Write the label policy. The bridge and the AI may see hosts labelled
env=demo. Hosts labelleddata=pciare reserved for people in thesecopsgroup.Add a webhook media type in Zabbix that posts each problem to the bridge, and an action that sends problems of Average severity and above to it. The key lives in a secret macro. The webhook's script builds a small JSON body:
var p = JSON.parse(value), req = new HttpRequest();
req.addHeader('Content-Type: application/json');
req.addHeader('X-API-Key: ' + p.key);   // {$SECRONYX_KEY}, a secret macro
req.post(p.url, JSON.stringify({alerts: [{
  status: p.status === '1' ? 'firing' : 'resolved',
  labels: {alertname: p.alertname, instance: p.host, severity: p.severity},
  fingerprint: 'zabbix' + p.triggerid + p.host}]}));
It posts to
https://fleet-proxy.example.com/integrations/webhook/alerts. Check the media type is enabled.Connect your AI. Claude Code connected to the fleet proxy as an MCP server with a key in the
ai-investigatorsgroup. We read the problem and the item's history from Zabbix's API with a read-only token and put them in the first prompt.
Try it on your fleet
Secronyx is in beta. Tell us about your fleet and we'll help you connect it to Zabbix.
Read more: fleet deployment · the Falco demo · the Elastic Security demo · the Alertmanager demo
Zabbix is a registered trademark of Zabbix LLC. Secronyx works with Zabbix through its standard webhook media type and API; it is not a Zabbix product or partner. Falco® is a registered trademark of The Linux Foundation. Claude is a trademark of Anthropic. AWS is a trademark of Amazon.com, Inc. or its affiliates. Other names are trademarks of their owners. Secronyx is not affiliated with, sponsored or endorsed by Zabbix LLC or Amazon.
Built 2026-11-11. Found a mistake? Tell us.